Beyond Mapping III
|
Map
Analysis book with companion CD-ROM for hands-on exercises and further reading |
Where Is GIS
Education — describes the
broadening appeal of
Varied Applications Drive GIS Perspectives — discusses how
map analysis is enlarging the traditional view of mapping
Diverse Student Needs Must Drive GIS Education — identifies
new demands and students that are molding the future of GIS education
Turning
GIS Education on Its Head — describes the
numerous GIS career pathways and the need to engage prospective students from a
variety of fields
A Quick Peek Outside
GIS’s Disciplinary Cave
— discusses
future directions
of geotechnology with particular emphasis on career outlook and GIS education
GIS
Education’s Need for “Hitchhikers” — establishes the need for engaging
“domain experts” in moving geotechnology to the next level
Fitting Square Pegs into Round GIS Educational Holes
— discusses
the need to engage non-GIS students in developing spatially distributed
solutions
Which
Direction Are You Headed? — describes
four perspectives on the trailing “S” in the GIS acronym
Questioning
GIS in Higher Education — describes
thoughts and notes from a panel discussion on “GIS in Higher Education”
<Click here> right-click
to download a printer-friendly version of this topic (.pdf).
***For more on GIS Education, see Education,
Vocation and GIS Enlightenment, 6th Annual
(Back to the Table of Contents)
______________________________
(GeoWorld, June 1997, pg. 30-31)
When coupled with a cell phone, they can call for help and
their rescuers will triangulate on the signal and deliver a gallon of gas and
an extra large pizza within the hour. Whether you are a lost explorer near the
edge of the earth or soul-searching on your Harley, finding yourself has never
been easier—the revolution of the digital map is firmly in place.
A new-age real estate agent can search the local multiple listing for suitable
houses, then electronically “post” them to a map of the city. A few more mouse-clicks allows
a prospective buyer to take a video tour of the homes and, through a
However, the “intellectual glue” supporting such Orwellian mapping and
management applications of
The classical administrator’s response is to stifle the profusion of autonomous
As with other aspects of campus life,
Assuming a balance can be met between efficiency and effectiveness of its
logistical trappings, the issue of what
The result is a patchwork of
The underlying theory and broader scope of the technology, however, can be lost
in the practical translation. While
geodetic datum and map projections might dominate one course (map-centric),
sequential query language and operating system procedures may dominate another
(data-centric). A third, application-oriented course likely skims both
theoretical bases (the sponge cake framework), then quickly moves to its
directed applications (the icing).
While academicians argue their relative positions in seeking
the “universal truth in
Varied Applications Drive
(GeoWorld, August 1997, pg. 28)
Our struggles in defining
We have been mapping and managing spatial data for a long time. The earliest systems involved file cabinets
of information which were linked to maps on the wall through shoe leather. An early “database-entry, geo-search” of
these data required a user to sort through the folders, identify the ones of
interest, then locate their corresponding features on the map on the wall. If a map of the parcels were needed, a clear
transparency and tracing skills were called into play.
A “map-entry, geo-search” reversed the process, requiring
the user to identify the parcels of interest on the map, then walk to the
cabinets to locate the corresponding folders and type-up a summary report. The mapping and data management capabilities
of
This new perspective of spatial data is destined to change our paradigm of map
analysis, as much as it changes our procedures.
As depicted in figure 1,
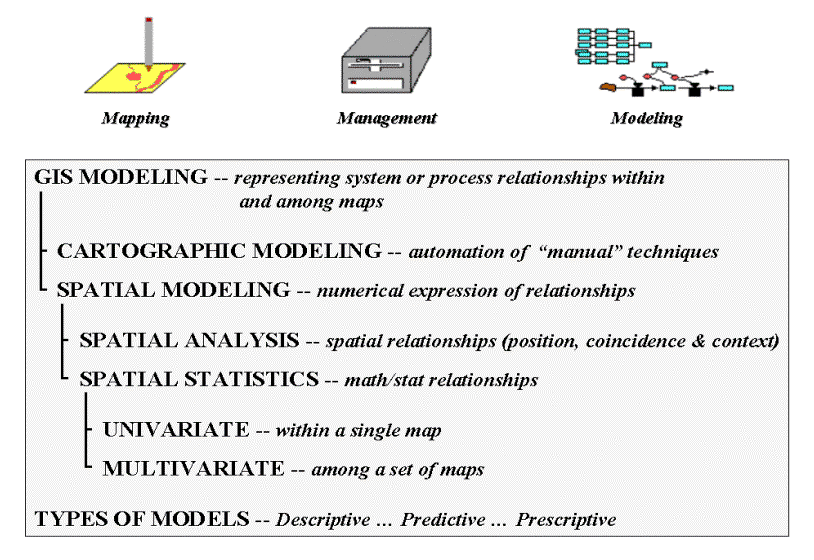
Figure 1. Various approaches used in
The numerical treatment of maps, in turn, takes two basic
forms—spatial statistics and spatial analysis.
Broadly defined, spatial statistics involves statistical relationships
characterizing geographic space in both descriptive and predictive terms. A familiar example is spatial interpolation
of point data into map surfaces, such as weather station readings into maps of
temperature and barometric pressure.
Less familiar applications might use data clustering techniques to
delineate areas of similar vegetative cover, soil conditions and terrain
configuration characteristics for ecological modeling. Or, in a similar fashion, clusters of
comparable demographics, housing prices and proximity to roads might be used in
retail siting models.
Spatial analysis, on the other hand, involves characterizing spatial
relationships based on relative positioning within geographic space. Buffering and topological overlay are familiar
examples. Effective distance, optimal
path(s), visual connectivity and landscape variability analyses are less
familiar examples. As with spatial
statistics, spatial analysis can be based on relationships within a single map
(univariate), or among sets of maps (multivariate). As with all new disciplines, the various
types of
In all cases,
(GeoWorld, September 1997, pg. 30-31)
Fundamental to understanding
Several concepts, however, represent radical shifts in the spatial
paradigm. Take the concept of map
scale. It’s a cornerstone to traditional
mapping, but it doesn’t even exist in a
Similarly, combining maps with different data types, such as multiplying the
ordinal numbers on one map times the interval numbers on another, is map-ematical suicide. Or
evaluating a linear regression model using mapped variables expressed as
logarithmic values, such as a PH for soil acidity. Or consider overlaying five fairly accurate
maps (good data in) whose uncertainty and error propagation results in large
areas of erroneous combinations (garbage out).
It is imperative that
The practicalities of implementing procedures often overshadow their
realities. For instance, it’s easy to
use a ruler to measure distances, but its measurements are practically useless.
The assumption that everything moves in a straight line does not square with
real-world—“as the crow flies,” in reality, rarely follows a straightedge. Within a
In practice, a 100 foot buffer around all streams is simple to establish (as
well as conceptualize), but has minimal bearing on actual sediment and
pollutant transport. It’s common sense
that locations along a stream that are steep, bare and highly erodeable should have a larger setback. A variable-width
buffer respecting intervening conditions is more realistic.
Similarly, landscape fragmentation has been ignored in
resource management. It’s not that
fragmentation is unimportant, but too difficult to assess until new
These new procedures and the paradigm shift are challenging
The diversity of users, however, often is ignored in a quest
for a “standard, core curriculum.” In so
doing, a casual user interested in geo-business applications is overwhelmed
with data-centric minutia; while the database manager receives to little. Although a
standard curriculum insures common exposure, its like forcing a caramel-chewy enthusiast to eat a
whole box of assorted chocolates. The
didactic, two-step educational approach (intro then next) is out-of-step with
today’s over-crowded schedules and the diversity
A potential user’s situation has a bearing on
Although non-traditional students tend to be older and even less patient, they
have a lot in common with the current wave of “out-of-step” traditional
students. They have even less time and
interest in semester-long “intro/next” course sequences. By default, vocational
training sessions are substituted for their
A mixed audience of traditional and non-traditional students
provides an engaging mixture of experiences.
So what’s wrong with this picture? What’s missing? Not money as you might guess, but an end run
around institutional inertia and rigid barriers. Adoption of
________________________________
Author’s Note: the first
three sections of this series on
Turning
(GeoWorld, May 2003, pg. 20-21)
Now that
As much as its technological underpinnings have changed,
In the 1990s several factors converged—sort of a perfect storm for
The early environments kept
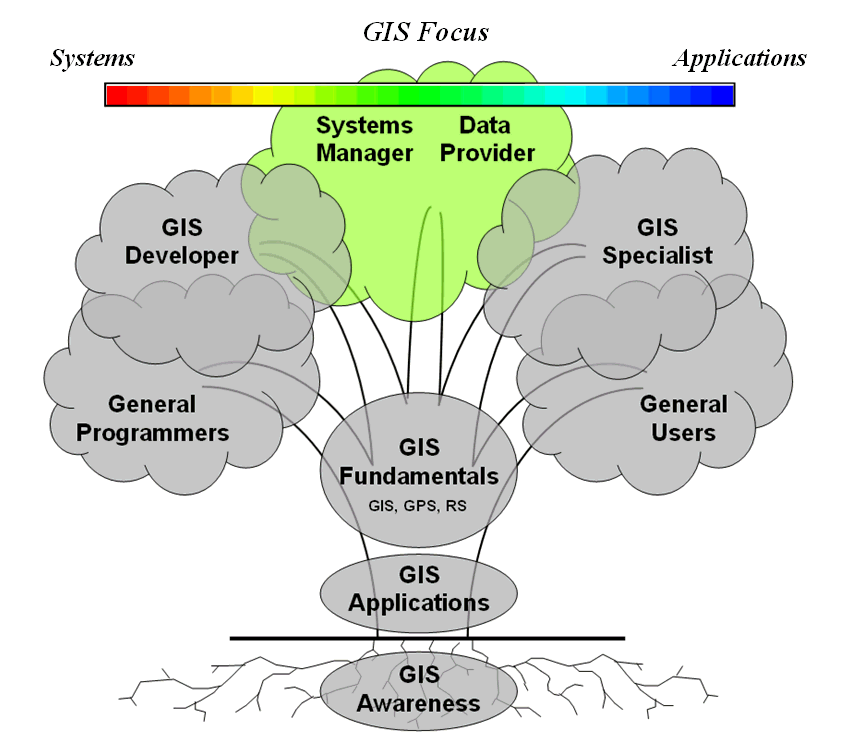
Figure 1. The
Figure 1 characterizes the
For example, the perspectives, skill sets and
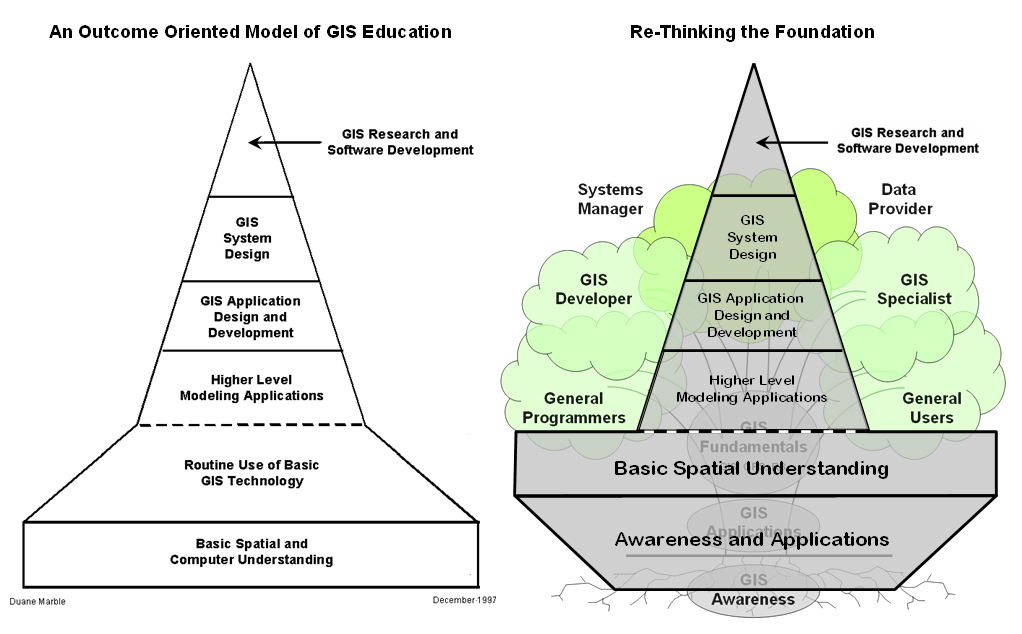
Figure 2.
Professor Marble with
These points are very well taken and reflect the evolution of most disciplines
crossing the chasm from start-up science to a popular technology. Marble suggests the solution “…appears to be
to devise a rigorous yet useful first course that will provide a sound initial
foundation for individuals who want to learn
So how can
The right-side of figure 2 turns the early phases of
Such experience wouldn't be a rice-cake flurry of "dog-and-pony show"
applications (e.g., frog habitat modeling in
That means that the next piece of the
The "up-side-down" approach suggests that the growing pool of
potential new users are first introduced to what
_________________
Author's Note:
See Marble, Duane F. 1997. Rebuilding the Top of the
Pyramid: Structuring
http://www.ncgia.ucsb.edu/conf/gishe97/program_files/papers/marble/marble.html.
Author’s
Update: (9/09)
Duane Marble in a more recent thoughtful article entitled “Defining the Components of the Geospatial
Workforce—Who Are We?” published in ArcNews, Winter
2005/2006, suggests that—
“Presently,
far too many academic programs concentrate on imparting only basic skills in the
manipulation of existing GIS software to the near exclusion of problem
identification and solving; mastery of analytic geospatial tools; and critical
topics in the fields of computer science, mathematics and statistics, and
information technology.”
(http://www.esri.com/news/arcnews/winter0506articles/defining1of2.html)
This
dichotomy of “tools” versus “science” is reminisce of the “-ists
and -ologists” differing perspectives of
geotechnology in the 1990’s.
For a discussion of this issue see Beyond Mapping III, Epilog, “Melding the Minds of the “-ists”
and “-ologists.” available at:
http://www.innovativegis.com/basis/MapAnalysis/MA_Epilog/MA_Epilog.htm#Melding_Minds.
Other related
postings are at:
-
http://www.innovativegis.com/basis/present/GIS_Rockies09/GISTR09_Panel.pdf, handout for
the panel on “GIS Career Opportunities,” GIS in
the Rockies, Loveland, Colorado; September 16-18, 2009.
-
http://www.innovativegis.com/basis/present/LocationIntelligence09/LocationIntelligence09.pdf
, handout
for the panel on
“Geospatial Jobs and
the 2009 Economy,” Location Intelligence
Conference, Denver, Colorado, October 5-7, 2009.
-
http://www.innovativegis.com/basis/present/imagine97/, a keynote address on
“Education,
Vocation and Enlightenment,” IMAGINE Forum, Lansing, Michigan, May 1997.
A Quick Peek Outside GIS’s Disciplinary Cave
(GeoWorld, January 2010)
Over the past few months I have had the opportunity to participate in several panels discussing the future directions of geotechnology, with particular emphasis on career outlook and GIS education (see Author’s Notes). One particularly intriguing “broad-brush” question setting the stage was “What are the most radical changes that we have seen in geotechnology’s evolution and that we will likely see in its future?”
In contemplating the question I realized that it wasn’t until the late
1990s that I fully realized the impact of the “perfect geotechnology storm”
brought on by the convergence of four critical enabling technologies; 1) the
personal computers’ dramatic increase in computing power, 2) the maturation of
GPS and RS (remote sensing) technologies, 3) a ubiquitous Internet and 4) the
general availability of digital mapped data.
If any one of these elements were missing, the current state of
geotechnology would be radically different and most certainly not as robust or
generally accepted. Much of our
advancement, particularly of late, has come from external forces. And now that we are “in the
limelight,” more and more of our evolution will be influenced by
non-specialists’ (vis., the GIS unwashed) and their perspectives on what
maps are and how they might be used.
In the early years, GIS was “down the hall and to the right,”
sequestered in a relatively small room populated by specialists. Users would rap on the door and say “Joe sent
me for some maps.” Today, geotechnology
is on everyone’s desk and in nearly everyone’s pocket. Contrary to most GIS perspectives, our
contributions have been as much a reaction to enabling technologies and outside
influences as it has been proactive in the wild ride to mass adoption.
Keep in mind that geotechnology is in its fourth decade—
-
the 1970s saw Computer Mapping automate the
drafting process through the introduction of the digital map;
-
the 80s saw Spatial Database Management link
digital maps to descriptive records;
-
the 90s saw the maturation of Map Analysis and
Modeling capabilities that moved mapped data to effective information by
investigating spatial relationships; and finally,
-
our current decade focuses on Multimedia
Mapping emphasizing data delivery through Internet proliferation of data
portals and advanced display mechanisms involving 3D visualization and virtual
reality environments, such as in Google and Virtual Earths.
The future of our status as a “mega-technology” alongside the giants of
biotechnology and nanotechnology will be in large part self-determined …that
is, if we step out of the specialist’s closet and fully engage other
disciplines and domain experts. The “era
of maps as data” (Where is What?) is rapidly
giving way to the “age of spatial information” where mapped data and
analytical tools directly support decision-making (Why, So What and What If?). The direct relevance of geotechnology isn’t
just a wall hanging, it’s an active part of the consideration of geographic
space; whether it’s a personal “what
should we do and where should we go?” decision on a vacation, or a professional
one for locating a pipeline, identifying wildlife management units or
establishing a marketing plan for a new territory.
The key for developing successful solutions beyond data delivery lies
in domain expertise as much, if not more, than mapping know-how. The geometrical increase in awareness and use
of geotechnology by the masses will lead to entirely new and innovative
applications that we haven’t even dreamed of (nor can we dream of them
in a geotechnology silo). The only way
we could drop the ball is to retreat further into our disciplinary cave.
On a technical front, I see a radical change in geo-referencing from
our 400 year reliance on Cartesian “squares” in 2-D and “cubes” in 3-D to
hexagons (2-D) and dodecahedrals (3-D) that will lead
to entirely new analytic capabilities and modeling applications (see Author’s
Notes). To conceptualize the difference,
imagine a regular square grid morphing into a grid of hexagons like a tray in a
bee hive. The sharp corners of the
squares are knocked-off resulting the same distance from the centroid to each
of the sides defining the cell …a single consistent step instead of two
different types of steps (diagonal and orthogonal) when moving to an adjacent
location. Now consider a three-dimensional
world with 12-sided volume (dodecahedral) replacing a cube …a single consistent
step instead of a series of differing steps to all of the surrounding
locations.
This seemingly slight shift in spatial theory, however, will
revolutionize our concept of geographic space.
At a minimum, it finally will dispel the false assumption that the earth
is flat …at least in our traditional map world that stacks two-dimensional map
layers like pancakes. At a maximum, it
will enable us to conceptualize, analyze and actualize spatial conditions
within a fully three-dimensional representation of the real world. Then all that we will need to do is to figure
out a way to fully account for time, as well as space, in our maps for a
temporally dynamic representation of geography—but that’s another story to be
written by tomorrow’s geotechnologists.
Another important trend reshaping geotechnology is its move toward
commoditization. Commoditization implies
the transformation of goods and services into a commodity thus becoming an undifferentiated
product characterized solely by its price, rather than its quality and features. The product is perceived as
the same no matter who produces it, such as petroleum, notebook paper, or
wheat. Non-commodity products, such as
televisions, on the other hand, have many levels of quality. And, the better a TV is perceived to be, the
higher its value and the more it will cost.
So where is geotechnology along this commoditization continuum? Like the other two mega-technologies (bio-
and nano-) it has a split personality
with both commodity and non-commodity characteristics. In our beginning, research dominated and the
mere drafting of a map by a plotter was perceived as a near miracle in the
1970s. Fast forward to today and digital
maps are as commonplace as they are ubiquitous—a transformation from
“knock-your-socks-off” to commodity status (and maybe “old dirty socks” that
ought to be avoided in a decade or so of 3D GIS technical advancements).
But we shouldn’t confuse mass adoption of a map product or service with
commoditization of an entire technology.
It is like the product life cycle in pharmaceuticals from trials, to
unique flagship drug, to generic forms and finally to commodity status. While the products might cycle to commodity,
industries don’t as long as innovation keeps adding value and new product
lines.
What is rapidly becoming a commodity in our field is generic mapped
data and Internet delivery. However,
contemporary value-added products and services are extremely differentiated;
such as a propensity map for product sales, a map of wildfire risk, and a
real-time helicopter routing map that avoids enemy detection. The transition is a reflection of a paradigm
shift from mapped data to spatial information—less of a focus on automating
traditional mapping roles and procedures, to an emphasis on new ways of
integrating spatial relationships into decision-making ...thinking with maps.
The bottom line is that commoditization of geotechnology is neither good nor bad, nor an advantage or disadvantage. It just is a natural progression of product
life cycles and renewed advancements in value-added features and services
through continued innovation. If we fail
to innovate, the entire industry will become commoditized and GIS specialists
will hawk their gigabytes of graphics in the geotechnology commodity market
next to the wheat exchange in Chicago.
The career take-home is that an individual can’t assume one brush with
a four-year smart pill in education is sufficient. An individual’s ability to go beyond
traditional mapping is the key— from a focus on management, access, display and
geo-query of spatial data (Descriptive Mapping that is more
“data-centric”) to an enlarged focus on integration of enterprise data,
value-added processing and applications of spatial information (Prescriptive
Mapping that is more “application-centric”). The discussion in the next section
investigates some of the pitfalls along the geotechnology career path and
education alleyways.
_____________________________
Author’s Notes: Summaries of the career/education panels are posted at www.innovativegis.com/basis/basis/cv_berry.htm#KeyNote. See the online book Beyond Mapping III
at www.innovativegis.com/basis/MapAnalysis/,
Introduction, “Referencing the Future” and Topic 27, “GIS Evolution and Future
Trends.”
GIS Education’s Need for “Hitchhikers”
(GeoWorld, February 2010)
The last section addressed a “broad-brush” panel question on “What are the most radical changes that we have seen in geotechnology’s evolution, and that we will likely see in the future?” The discussion invoked an assessment of the four-decade trajectory of GIS, both in terms of its driving forces and incremental capabilities and utilities.
Another very basic question that seems to be making the circuit is “Where
do we go from here? …and how do we make it happen?” As
background, one needs to realize that we have established the basic means of
encoding, analyzing, visualizing and storing geographic information, and have
the prerequisite computer power to digest it all. In addition, we have maturing standards and a
huge quantity of mapped data content in terms of vector and image data—lock and
load, but what is the target?
To many, the future target is a giant leap beyond mapping and spatial
record-keeping to full integration of geotechnology into real world
decision-making processes— from land management to building design to retail
marketing to environmental protection and a myriad of other applications. While I am sure there are technical waypoints
along the path we take from here, the human element likely will be the most
critical factor of forward progress, with a revamping of the education
component leading the way.
It’s interesting to note that our earliest tinkering with GIS had a
huge tent with zealots from all disciplines tossing something into the stone
soup of an emerging technology—foresters, engineers, geographers,
epidemiologists, hydrologists, farmers, geologists to mention but a few. As the field matured the big tent’s diversity
contracted considerably as “specialists” emerged and formal programs of study
and certification surfaced.
There are many positive aspects in this maturation, but there also are
some drawbacks. In many universities, a
GIS Center of Excellence emerged and lodged in a disciplinary stovepipe of a
single college or department. In
addition, the maturation of the field resulted in a “one shoe fits all”
curriculum with focus on training tomorrow’s GIS’ers.
But this educational footing is far too limited for a leap from mapping
to modeling. The breadth of potential
applications suggests that geotechnology is ill served as the special domain of
any discipline, or even coalescence into a discipline unto itself. A continuum of diverse activists have and are
shaping geotechnology’s future— from those “of the computer,” such as Computer
Programmers, Solutions Developers, and Systems Managers, to
those more “of the application,” such as Data Providers, GIS
Specialists, and General Users (figure 1).
Historically, digital mapping tilted toward the right side of the
continuum as GIS specialists established and nurtured vast databases that
automated existing business practices.
Then map analysis and modeling shifted focus toward the left side with
Solution Developers doing the heavy lifting by providing new capabilities,
models and turnkey solutions.
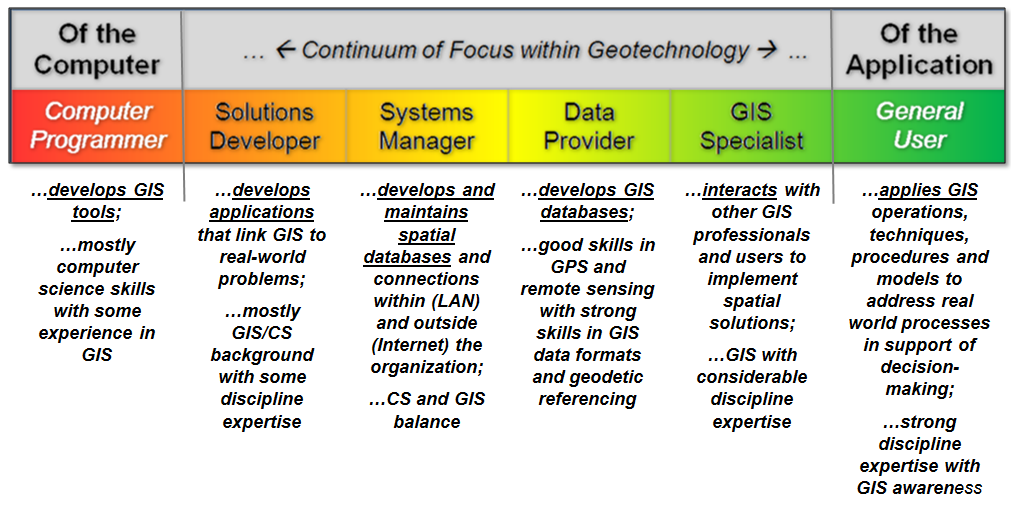
Figure 1. The continuum
of the GIS community reaches from computer science development to a mosaic of
general user applications.
However, the “bookends” of this continuum are the current drivers. Increasingly, computer science and
technological advancements in visualization and access are at the
frontier. With the full embrace of RS,
GPS and GIS by Google, Oracle and other “big-hitters” in the computer industry,
geotechnology’s applications are becoming ubiquitous.
It is hard to pick up a magazine, watch TV or attend a conference that
new and powerful ways of accessing and interacting with mapped data aren’t
being ballyhooed—my grandmother would be proud.
For first time society comprehends a paperless map and marvels at its uses,
from saving lives with OnStar to finding a store
across town to zooming in to a beach in Belize.
While geotechnology is at the foundation, it has been applied computer
industries that hit the ball out of the park.
It is widely purported that eighty percent of all data has a spatial component
but simply “mapping to visualize” these data is rarely sufficient in many
decision-making arenas. Geotechnology’s
next leap forward will be lead by the other bookend group—involving the active
participation of domain experts in development of entirely new applications
addressing complex spatial relationships.
The old adage that “those with the problems have the solutions” apply
applies.
As long as the questions involved “how do I map that?” or “where
is what?” GIS’ers at the core of the continuum could take the lead. But as questions progress to “why and so
what?” and “do what where?” the solutions move well beyond
mapping—to spatial reasoning, dialog and problem solving.
Within a modeling context, disciplinary knowledge of underlying concepts,
assumptions, state variables, driving variables, processes, rates and limits
becomes paramount. In most fields,
understanding of these relationships has been developed through years of
non-spatial science. The idea that
spatial considerations could be “addressed spatially” is foreign—“shouldn’t all
that data be collapsed to a mean and standard deviation?” The notion that there are tools for
characterizing geographic distributions and relationships within and among
mapped data has been outside their experience base, and all too often outside
their comfort zone.
But domain expertise is the key ingredient for innovative solutions of
complex spatial problems. The direct
engagement of bright minds with a practical understanding of the dimensions and
complexities of a potential application has been the “missing link.” In large part, a “campus chasm” that is too
onerous for most students to cross proves to be the barrier.
Contributing to the divide is that the preponderance of geotechnology education
focuses on “discrete spatial objects” as a set map features composed of
Points, Lines and Polygons (Vector perspective). However, most spatial models focus on “continuous
spatial distributions” of geo-registered map variables expressed as gradient
Surfaces (Raster perspective) with all of the rights, privileges and
responsibilities of a true “map-ematics.”
This requires a paradigm shift from our current thinking of what GIS is
and isn’t— from a mapping focus (warehousing, accessing and visualizing mapped
data) to an application focus (solving spatial problems). This involves a conceptual shift, not just a
structural change. For many GIS’ers the
thought is a bit outside their experience but for non-GIS’ers it is a totally
foreign and “off-the-wall” perspective of a map.
In an earlier section (“Turning GIS on Its Head,” GeoWorld, May
2003; see Author’s Note) discussion suggested that the traditional
didactic approach of “fundamentals first, then applications” severely limits
the breadth of exposure of geotechnology across campus. While a “data-centric mindset” that
geotechnology education starts with geographic/cartographic principles and
proceeds through software mechanics works for the inner core players along the
GIS continuum, it effectively excludes the bulk of the bookend players.
An alternative is an introductory experience where students interact
with the mapping and modeling capabilities at the onset without knowledge of
mapping “details,” such as geodes, datum and projections. Within this context, the early focus is
shifted to a grasp of the problem solving capabilities of geotechnology— an “application-centric
education.” Toward the end of the
experience the mapping details can be introduced within the context of accuracy
and precision assessment, rather than establishing a set of working skills
required in the mechanics of database development and maintenance.
Ideally, this experience aligns with students disciplinary
interests. As with other aspects of
campus life, geotechnology can benefit more from its diversity than from its
oneness. It’s often perceived condition
as a divorced discipline for specialists on the other side of campus has
dramatically hindered geotechnology from reaching its full potential as a
fabric of society, and spatial reasoning as a matter of fact.
To accomplish this transition we need to engage applied “domain
expertise” in GIS offerings. This means
that outreach across campus as important (and quite possibly more important)
than honing courses for training core professionals. This perspective suggests less
flagship/toolbox software systems and more custom/tailored packages
solving well-defined spatial problems that stimulate “thinking with maps.” The next section will investigate approaches
and procedures that can be used to move beyond the perception that
_____________________________
Author’s Notes: A more detailed discussion of
the need to infuse spatial reasoning into non-GIS curricula is posted online at
http://www.innovativegis.com/basis/MapAnalysis/Topic4/Topic4.htm#Turning_GIS_education,
“Turning
Fitting Square Pegs into Round GIS Educational
Holes
(GeoWorld, March 2010)
Last section suggested that geotechnology needs “hitchhikers” to reach beyond mapping. The technology’s first three decades capitalized on the development of the digital map, first simply for Computer Mapping, then for Spatial Database Management and then for Map Analysis by exploiting entirely new encoding, storage, processing and display tool sets that were radically different from our paper map legacy (figure 1).
Through the 1990’s, the new kid on the block, Geographic Information
Systems and Science, was in the driver seat and in control of the emerging
technology. However with the new
millennium, geotechnology matured into a mega-technology that captured the full
attention of the computer industry and its reading of the huge potential market
for Multimedia Mapping and Visualization. The result was near commoditization of many
traditional digital mapping capabilities—tremendous mass acceptance and use
occurred, but innovation shifted from the GIS community core toward the
computer science bookend.
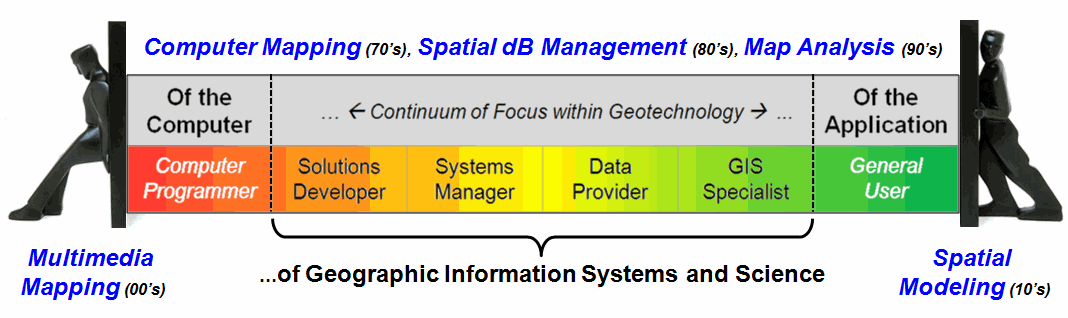
Figure 1. The bookends
of the continuum of the GIS community are the current drivers of Geotechnology.
Looking forward into the next decade two dominant thrusts seem to be
surfacing. While the bulk of the GIS
community will continue to develop and expand the digital map repository, a
small group of innovators will work with computer scientists to radically
revolutionize our current data and processing structures. A somewhat larger contingency will engage
general and innovative users in developing Spatial Models that integrate
domain expertise, spatial reasoning and map analysis tools in support of
solutions and decision-making.
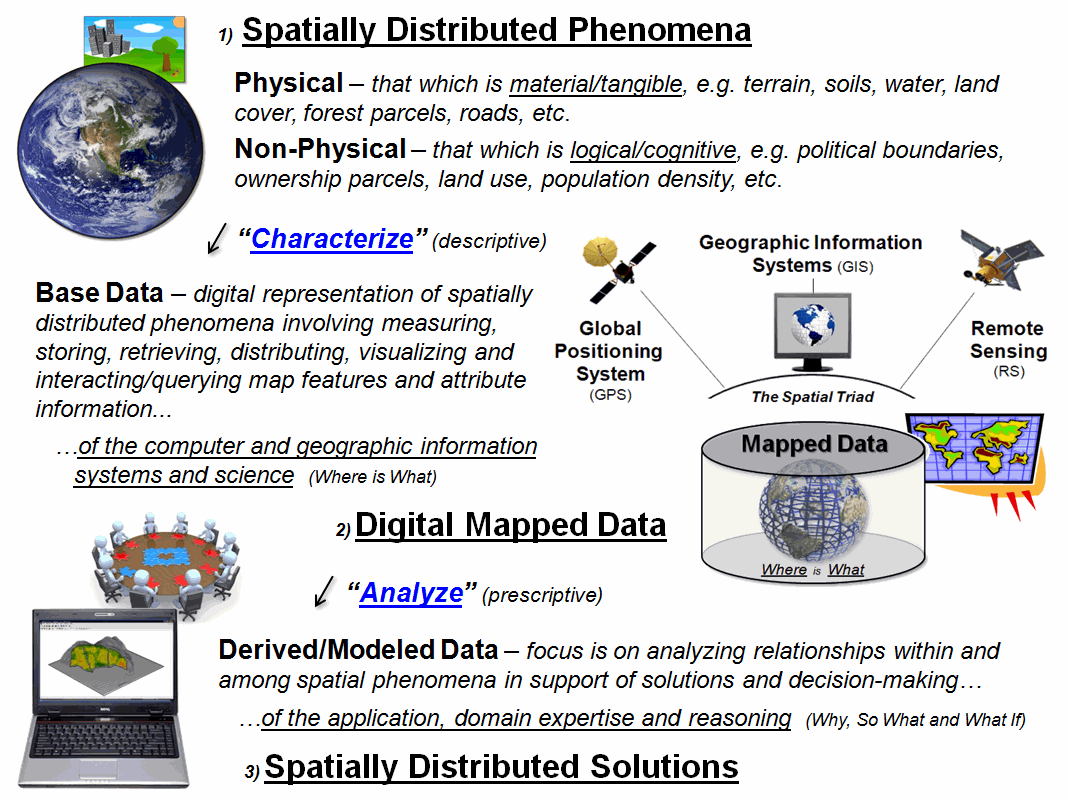
Figure 2. Map analysis and modeling extend mapped data
to spatial solutions.
Figure 2 depicts the major components involved in spatial
modeling. Historically, maps focused on
precise placement of physical features (material/tangible) primarily for
navigation. As mapping evolved more
non-physical information (logical/cognitive) found its way into map form. In the past few decades both types of
descriptive characterizations of spatial phenomena have been incorporated into
huge digital mapped data repositories identifying “Where is What”
with sophisticated tools for interacting with the data.
The step from digital map data to spatially distributed solutions
involves a paradigm shift from descriptive “Where is What”
mapping to prescriptive “Why, So What and What If” modeling. This transition in emphasis involves the
other bookend (users) as much, or more, than it involves the core GIS
community. It suggests that spatial
reasoning needed for the transition lies outside the usual knowledge, skill
sets and experience of GIS’ers. However,
most GIS curricula are designed to service the core community with minimal
attention to reaching other disciplines—they can take our established courses,
but targeted courses for non-GIS’ers focusing on spatial problem identification
and solving are rare indeed.
Yet the development of curricula and courses for the “unwashed” likely
will determine geotechnology’s future.
If we are to reclaim a share of driver’s seat we need to instill closer
and active relationships with the bookends of the GIS community. The small group of technology innovators
seems well along the way through research initiatives and industry investments.
The knurly problem lies in engaging a dispersed set of applied
disciplines to develop awareness and skills in spatial reasoning. The old adage “they don’t know what they
don’t know” applies and over-stuffed disciplinary curricula keeps most students
at bay. What elective “holes” are available
are usually tied-up by concentration tracks that delve even deeper into their
discipline. This, coupled with a
university administrative structure that struggles with inter-disciplinary
efforts, effectively limits exposure of most students to spatial reasoning and
problem solving.
Two potential remedies to this disciplinary stovepipe “standoff” seem
viable—both requiring the initiative of the geotechnology academic
community. First, a concerted “outreach”
program needs to be developed where GIS students are encouraged to develop a secondary
disciplinary thrust that focuses on spatial problem solving instead of the
usual database compilation concentration.
In addition, faculty needs to develop secondary ties across campus that
actively contribute to teaching and research involving spatial reasoning within
applied disciplines.
An important step in this outreach is recognizing that the GIS tool
isn’t the focus and “training” outside students/faculty in the nuances and fine
distinctions of database construction and GIS software isn’t relevant. The objective becomes developing an awareness
of the capabilities of GIS through instructive case studies coupled with simple
hands-on exercises.
Hands-on experience is critical but it can’t be the same as for
traditional GIS students. Flowcharts
provide a mechanism for interacting with a spatial model’s logic and its
processing expression (e.g., ArcGIS’s Model
Builder). The link between step-by-step
logic of a model and the sequencing of the commands becomes the objective. For example, figure 3 uses MapCalc Learner
(see Author’s Note) to decipher a region-wide overlay summary that derives the
average slope within three watersheds.
Note that the command forms a complete grammatically correct sentence
that resonates with less-technical students and that the contextual help
provides information on additional summary options providing fodder for further
discussion.
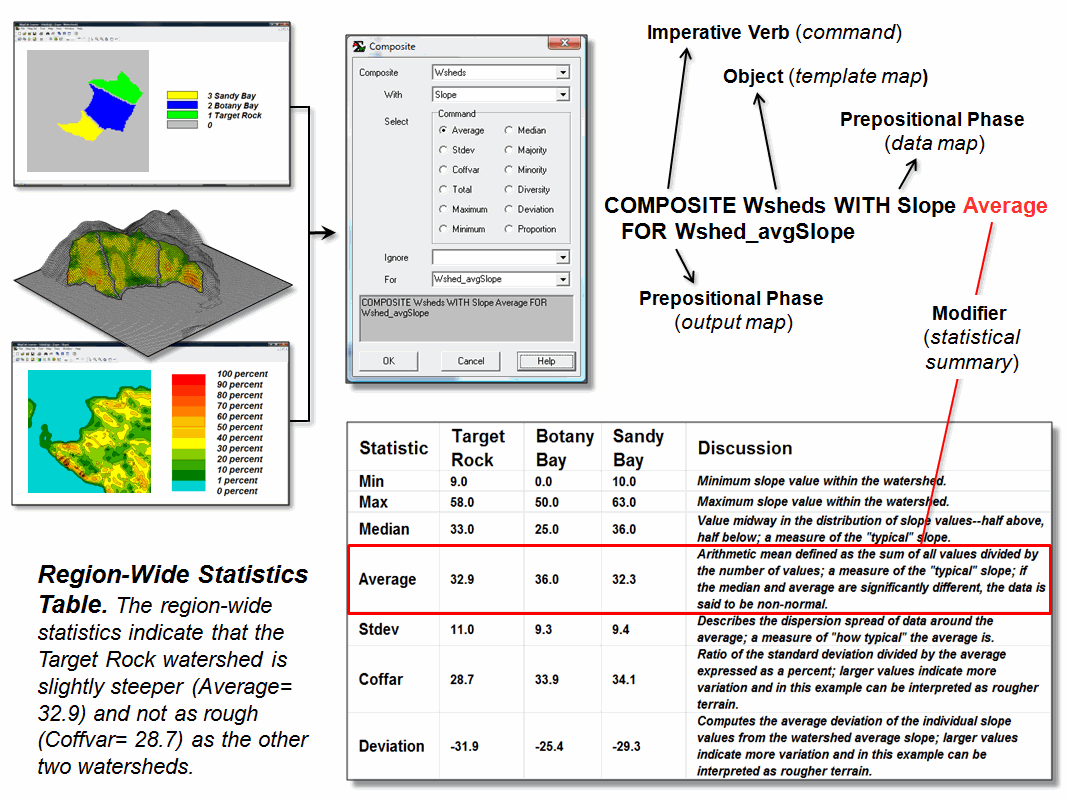
Figure 3. Effective education for non-GIS students
shifts the focuses from mapped data to interacting with model logic and its
spatial reasoning foundation.
As GIS education moves beyond mapping the emphasis lies in full
engagement of cross-campus entities.
Like remora and the shark, a symbiotic relationship with applied
disciplines is what will take us there.
_____________________________
Author’s Note: A listing of several MapCalc
Learner “application exercises” used in special presentations for various
applied disciplines are at www.innovativegis.com/basis/Senarios/Default.html#Application_examples. The educational software system can be
downloaded for free.
Which Direction Are You Headed?
(GeoWorld, January 2011)
In another section (see Author’s Note), I commented on using the more generalized and palatable term Geotechnology to describe what some of us over time have referred to as Automated Cartography, Computer Mapping, Geographic Information Systems, Spatial Database Management, Desktop Mapping, Geospatial Technology, Geomatics, Map Analysis, Multimedia Mapping and a wealth of other terms.
The discussion identified the Spatial Triad of Remote
Sensing (RS), Geographic Information Systems (GIS) and Global Positioning
Systems (GPS) as core technologies that “utilize spatial location in
visualizing, measuring, storing, retrieving, mapping and analyzing features or
phenomena that occur on, below or above the earth.” While RS and GPS seem to have fairly
succinct and universal meanings, the definition of GIS has sparked continuing
debate. Most will agree on something
like GIS is “a system of hardware and software used for storage, retrieval,
mapping, and analysis of geographic data.”
But what is the interpretation the acronym itself?
My first encounter in the acrimonious acronym dispute was in the
mid-1970s when the “G” in GIS was under scrutiny. The early GIS folks on the west side of the
Atlantic were convinced it stood for “geographic,” while those on the
eastern side insisted it stood for “geographical.” A quick Google search yields a boat load of
discussion forums still hammering on the grammatical debate. It appears that it boils down to that the “…ic” in geographic means “of or pertaining to
geography," whereas the “…cal” in geographical means “of
geographic"—there seems to be more style than substance in the debate, as
both terms are adjectives.
The “I” in the GIS acronym seems to be accepted by all as “meaning or
pertaining to information.” The important
point to be made here is that data are simply facts without context.
When data are processed, organized and structured within a given context
to make them useful, they become information. This is a significant distinction to keep in
mind as we tackle the different perspectives and interpretations of the
trailing “S” in GIS.
It is the “S” that carries considerable conceptual, as well as
grammatical baggage. Early debate
focused on whether it meant “system (singular)” or “systems (plural).” The sides at the time seemed to align with
whether one had a comprehensive turnkey commercial system, or cobbled together
a bunch of public domain software packages.
With the advent of today’s specialized apps, mash-ups, cloud computing
and the like, it seems that the “S” might be shifting back toward the plural
and away from a flagship system paradigm.
Figure 1 takes the debate beyond the grammatical by outlining different
substantive interpretations of the trailing “S” that greatly impacts GIS education,
career planning, on-the-job skills and depth/breadth of understanding of
spatial concepts, procedures and applications.
The figure intentionally uses the intermediary compass positions
(officially termed “intercardinal or ordinal”) of NE, SE, SW and NW as a nod to astute geographers and as an
indication that that the categorization blends fairly rigid “near cardinal”
viewpoints.
At the birth of the discipline, the “S” unequivocally stood for the
hardware, software and dataware with little or no
reference to people or use—simply GISystems. In this early stage (1970s) the focus was on
just cobbling together a system that could handle digital maps without
crashing. The dream might have been
boundless utility but the practical reality was whether maps as numbers was a
viable concept and could be shoehorned into the tinkertoy
computing environments of the day.
Today, the GISystems perspective still holds
that the GIS enabling mechanisms are paramount.
Like the pit crew in a NASCAR race, GIS can’t go anywhere without a
finely tuned and fueled computing environment.
However, over the years the “systems” interpretation has expanded to GISpecialist, GIScience, and GISolutions that primarily respond to differing
perspectives on the data versus information distinction.
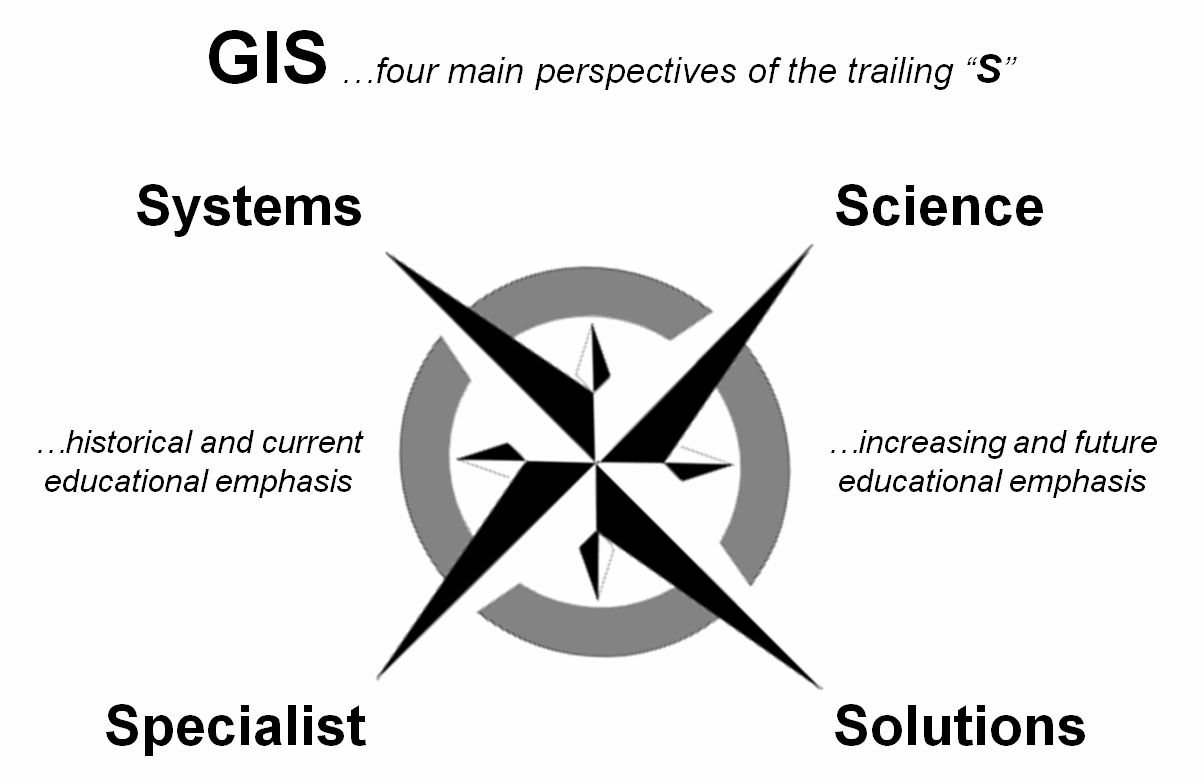
Figure 1. Four
perspectives on the trailing “S” in GIS.
The idea that the trailing “S” defines GISpecialist
took hold in the 1990s as the result of two major forces—uniqueness and
utility. As GIS shifted from the
“Eureka, it’s alive” perspective of the early GIS
innovators to an operational systems outlook, the uniqueness of different
application environments became apparent.
Enterprise systems sprung up and needed specialists who understood the
unique character of an organization’s spatial data and could serve as in-house
experts in its care, feeding and use. By
enlarge the GISpecialist’s role was that of a “down
the hall and to the right” resource that field, managerial and executive folks
could tap when they needed maps and spatial information.
Numerous certificate and certification programs were designed to
produce the needed specialists. At the
same time a GIScience
perspective took hold that recognized a more in-depth discipline was coalescing
and would serve full undergraduate and graduate degrees in geotechnology. The GISpecialist
has evolved into a “practitioner” role (what does it take to keep a GIS alive
and how can it be used?) while the GIScience
perspective tends more toward the “theoretical” (how does GIS work, how could
it be improved and what else could it do?).
A fledgling GISolutions
perspective has been around for some time, but seems to be capturing a lot more
attention. Early GIS solutions focused
on mapping and geo-query that primarily automated existing business
practices. Cost and time savings in
maintaining and accessing mapped data were at the heart of these highly
successful applications.
However as digital mapped data became more available, interest turned
to how the paper-map-based practices might be enhanced to improve operations
and decision-making. Today, the focus
seems to be on entirely new GIS applications from iPhone crowdsourcing to
Google Earth visualizations of real-time spatial information to advanced map-ematical models predicting wildfire behavior, customer
propensity to buy a product and optimal routing of a powerline.
The “GI” (Geographic Information) component seems to be a universal
root, but the trailing “S” has evolved through differences in perspective of
what GIS is and isn’t. The GISystems and GISpecialist roles
form the foundation of geotechnology’s contemporary expressions whereas the GIScience and GISolutions roles
determine its future directions.
_____________________________
Author’s Note: For a discussion on Geotechnology as an encompassing term, see Beyond Mapping III, Introduction, “What’s In a Name?” posted at www.innovativegis.com/basis/MapAnalysis/MA_Intro/MA_Intro.htm#Name).
Questioning GIS in Higher Education
(GeoWorld, June 2012)
Recently I had the opportunity to sit on a panel concerned with “GIS in
Higher Education: Simultaneously Trivializing and Complicating GIS” (see author
note 1). In about an hour of interactive
discussion we only addressed a couple of the planed questions. Below are thoughts and notes from the ones we
discussed and initial thoughts on those we didn’t get to.
Question: Is there an inherent
responsibility for the GIS community in higher education to further general
awareness and understanding of geotechnology (RS, GIS, GPS) across
campus? If so, in what ways can we provide opportunities for
non-GIS faculty and students to learn about GIS capabilities as a “technology
tool” and as an “analysis tool” considering interdisciplinary education
constraints and considerations (e.g., budget, organization, time, promotion/career
considerations, etc.)?
[Note: during the break prior to the
panel, I sketched the “technical tool” versus “analytical tool” trajectory on
the whiteboard (figure 1)]. The use of GIS as a “technical tool” has
skyrocketed, while its use as an “analytical tool” has relatively stalled over
the past decade.
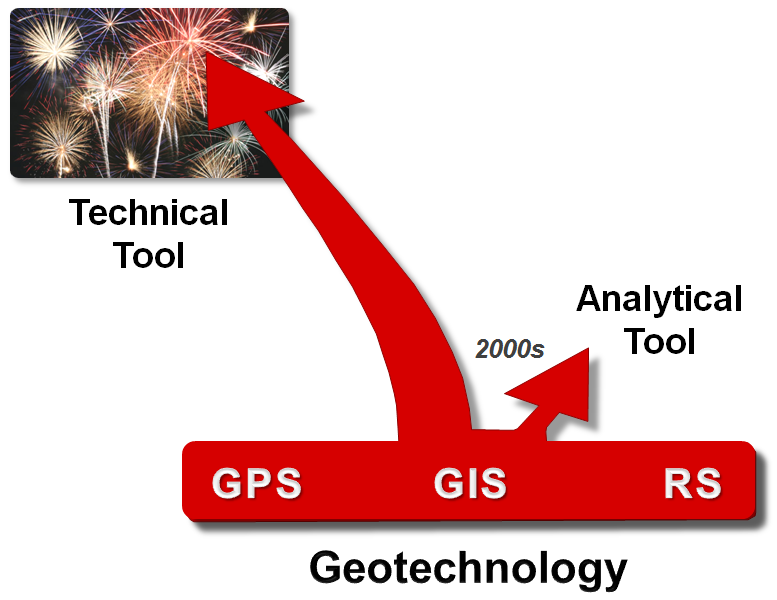
Figure 1. During the past decade GIS as a “technical
tool” has skyrocketed, while its use as an “analytical tool” has relatively
stalled.
In the current euphoria of GIS as
a “technical tool,” the marketplace is defining not only what GIS is, but its
future. To some degree, higher education
in GIS on many campuses seems to have abdicated a primary leadership role and
tend to have taken a “vocational role” focusing on training GIS-specialists.
To most folks on campus, geotechnology
is simply a set of highly useful apps on their smart phone or a 3D fly-by
anywhere in the world— in a sense trivializing GIS. To a smaller contingent on campus, it is
career path that requires mastery of the mechanics, procedures and buttons of
extremely complex commercial software— in a sense complicating GIS.
Any new or rapidly evolving
technology has an inherent responsibility to further general awareness of the
full potential of the technology. The
technical tool’s mapping, display and navigation capabilities seem to be easily
learned through vender promotion and peer pride “look at what this can do”
instruction.
However the radical nature of the “analytical
tool” perspective drastically changes how we perceive and infuse spatial
information and reasoning into science, policy formation and decision-making—
in essence, how we can “think with maps” for solving complex spatial problems. To achieve our billing as one of the three
mega-technologies of the 21st century (Bio-, Nano-
and Geotechnology) we need to 1) insure that spatial reasoning skills are
taught K12 through higher education, 2) instill the idea that modern digital
maps are “numbers first, pictures later” and 3) these organized sets of numbers
support quantitative analysis.
I am increasingly struck by the
thought that we are miss-communicating GIS’s potential, particularly with the science
communities on campus who ought to be excited about infusing spatial
considerations into their research and teaching. The result is that innovation and creativity
in spatial problem solving are being held hostage to 1) a trivial mindset of
maps as pictures, 2) an unsettling feeling that GIS software is too complex,
and 3) a persistent legacy of a non-spatial mathematics that presupposes spatial
data can be collapsed to a single central-tendency value that ignores any
spatial variability inherent in the data.
The most critical step in
providing opportunities that further general awareness and understanding across
campus is to recognize the inherent responsibility of non-GIS student
education, as well as traditional GIS specialists. Specific actions might include—
-
Encourage seminars
demonstrating applications,
-
Establish a networking
organization encompassing all interested disciplines,
-
Teach a class or lab
for a department outside of your own,
-
Organize or team-teach
a discipline-oriented workshop with a domain expert,
-
Write proposals for
non-GIS teaching, research and outreach,
-
Solicit VP-level
administers’ support for integrated efforts, and
-
Consider adopting a SpatialSTEM approach that translates
grid-based map analysis operations into a mathematical/statistical framework that
serves as the communal language of science, technology, engineering and
mathematics disciplines (see author note 2).
OK, that’s my Pollyanna
perspective …what’s the chance that an enlarged view of GIS education will ever
take root on your campus? …what would it
take?
Question: What are the similarities and differences
between GIS and non-GIS students (e.g., background, interests, time,
career aspirations) and what similarities and differences are there in structuring
course content and “hands-on” experiences (e.g., formal class, workshops,
seminars)?
My experience is that non-GIS students are less interested in the
mechanics of GIS and more interested in how GIS might be applied in their field
to solve problems. For the past few
years I have had considerable proportions of students outside of Geography/GIS
in my graduate course in GIS Modeling at the University of Denver (see author
note 3) with more outside students than inside this past term, as well as two qualified
undergrads. These students know little
about traditional GIS concepts (geodes, coordinates, projections, data
structures, cartography, etc.) but in most cases a lot about quantitative
methods for analyzing data.
I use an easy-to-learn grid-based software package (MapCalc Learner,
see author note 4) in the course that students load onto their personal
computers along with the databases used in the weekly homework
assignments. The 3-hour class meeting is
consumed with lecture and discussion (no formal lab sessions). The students work in 2-3 person teams on
their own and are expected to complete the homework assignment as a
professional report (format, spelling, grammar, composition are graded) with
discussion and appropriate screen grabs of their results—more problem-solving
than lab exercise.
I believe several “characteristics” of non-GIS students can be
identified—
-
Interested in applying GIS to solve problems in
their field,
-
Rarely to mildly interested in becoming
GIS-specialists,
-
Want to know the basic concepts, procedures,
considerations and limitations of the technology,
-
Focused on the utility of GIS to them (minimally
interested in RS or GPS),
-
Concerned about the practical aspects of GIS (e.g.,
software, data availability) , and
-
Generally interested in the future directions of
GIS.
I believe some fundamental “characteristics” in structuring an
educational offering for non-GIS students (course, short course, workshop,
guest lecture/lab or seminar) to consider are—
-
Tailoring the presentation to the audience’s interests,
disciplinary background and current spatial problems is critical (GIS for GIS
sake is unacceptable),
-
Instructor “hands-on demonstrations” (or student
hands-on exercises) are extremely valuable,
-
Animated slides that sequence logical steps in
developing a concept is preferable,
-
Ample time/opportunity for discussion is important
(Socratic questions as lead-in to topics are effective), and
-
Links to online further readings/references are
useful.
OK, that’s my scar-tissue-based advice …what has been your
experience(s) in presenting GIS to non-GIS folks? …what words of advice can you share?
Question: Given the advance and convergence of Citizen
Science/Volunteered Geographic Information, mobile and easy-to-use
geo-technologies, the open data movement, and cloud-based GIS, is everyone a
geographer? Is everyone able to easily ramp into a GIS career?
-
GIS as an interactive “technical tool” for map
viewing, navigation and geo-query is for everyone (potentially billions of
users; negligible skills required),
-
Map making today primarily involves choosing a
template and following a wizard’s guidance from the cloud so just about anyone
can be a map maker (millions; minimal skills),
-
GIS as an “analytical tool” is for many individuals
as they augment their domain expertise with spatial reasoning and
problem-solving skills (millions; considerable skills), and
-
GIS as a career is not for everyone (hundreds of
thousands; considerable skills).
Question: How will cloud computing and interactive
applications impact GIS education both from a GIS-specialist and a GIS-user
perspective?
-
For the GIS specialist they need a working
knowledge of structuring online databases and interactive services/solutions in
the cloud, and
-
For the GIS user they will be free from flagship
software demands and will be able to utilize very large data sets and services
from the get-go, and
-
Lat/Lon grid-based referencing will become a
universal key for joining currently disparate data sets in the cloud.
Question: What does the GIS education community
need to do in the next 1 to 3 years to ensure that spatial analysis,
geographic inquiry, and GIS are supported, taught, and used throughout the
educational system?
-
Teach the teachers,
-
Help construct tailored introductory lectures/labs
for existing courses in other disciplines, and
-
Develop/promote/offer courses for non-GIS students
(ideally team-teach with domain expert).
Question: What types and levels of computer
knowledge/expertise and quantitative methods will be required for
developing successful GIS applications and solutions?
-
We need to develop in our GIS students a better
understanding of grid-based spatial stat/math operations and quantitative
analysis methods,
-
Instill skills in general-purpose, high-level
programming languages, such as Python, for integrating systems and programs
with GIS, and
-
Instill skills that
are needed for the production and maintenance of websites (web design and
digital media studies).
Question: What factors are most limiting to the
continued development of GIS education on your campus (student interest,
colleague backing, workload, promotion/tenure process, administration support,
space, budget, etc.)?
-
Promotion and tenure doesn’t fully recognize
interdisciplinary efforts,
-
Budgets for interdisciplinary courses and teaching
are not readily available on most campuses, and
-
Departmental workload does not provide time for
efforts outside of the department.
The bottom line is that the GIS academic community has an intellectual
and noble responsibility to educate non-GIS students in the full capabilities
of geotechnology and how it is changing our paradigm of what maps are and how
they can be used from a historical perspective of “Where is What” to a modern
expression of “Why, So What and What If” within problem solving contexts. The rub is that there is minimal incentive,
encouragement or support in turning the academic tanker— at this point a few charitable
GIS’ing zealot professors are needed.
_____________________________
Author’s Notes: 1) GIS in Higher Education Symposium,
Metro State College, Department of Geography, Denver, Colorado; April 6,
2012. 2) See www.innovativegis.com/basis/Papers/Other/SpatialSTEM/SpatialSTEM_case.pdf.
3) You can review all of the GIS
Modeling course materials to include lecture PowerPoints, exercises, exams and MapCalc
Learner software used at www.innovativegis.com/basis/Courses/GMcourse12/.
4) For more information on freely distributed MapCalc Learner, see www.innovativegis.com/basis/,
select Software items.