|
Topic 5 – A Framework for
GIS Modeling |
Spatial Reasoning
book |

What’s
in a Model?
— describes
a conceptual framework for GIS model types and characteristics
Dodge
the GIS Modeling Babble Ground — identifies a Classification
Guide for categorizing GIS models
Layers to Tapestry — describes an interactive environment for diagramming GIS Logic and
processing flows.
<Click here> for a printer-friendly version of this topic
(.pdf).
(Back to the Table of Contents)
______________________________
What’s in a Model?
(GeoWorld, January 1995)
Each year I conduct a lot
of GIS courses and workshops. As you
might imagine they frequently move beyond the fundamental concepts to
futuristic musings. One topic
consistently captures the imagination of the participants and dominates informal
discussion (you know, the elevated B.S. in the sunken lounge): What are the
types and characteristics of GIS models?
The accompanying outline is the current state of a “sourdough” handout
used to provoke this impassioned discussion.
Keep the following questions in mind while you review the outline:
-
Do you know of any model types or
characteristics missing from the outline?
Are there any in the outline misrepresented?
-
The following are other terms often used to
describe models: physical, atomistic, holistic, constrained, fragmented,
dispersed, data, diffusion, scale, optimizing, simulation, analytical, process,
synthetic, systems, flow, statistical, mathematical, hierarchical, binary …Can
you explain what is meant by these terms?
Are any relevant to GIS? If so,
where might they fit into the outline?
-
Do you see any utility in developing a
comprehensive classification scheme for GIS modeling, or is this just another
esoteric or academic (gee, that might be redundant) exercise? Who might benefit from such an outline?
1) Modeling: a model is a representation of reality in either material form (tangible representation)
or symbolic form (abstract
representation); GIS modeling involves symbolic representation of locational (WHERE), as well as thematic (WHAT) and temporal (WHEN) attributes describing characteristics and
conditions of space and time.
2) General
Types of Models: Structural and
Relational
a) Structural. Focuses on the composition and
construction of things; object and action.
i) Object. Static entity-based, forming a visual representation of an item, e.g., an
architect’s blue print of a building.
Characteristics include scaled, two- or three-dimensional, symbolic
representation.
ii) Action. Dynamic movement-based, tracking space/time relationships of items, e.g, a model train along its track. Characteristics include time-slices, change
detection, transition statistics and animation.
b) Relational. Focuses on the interdependence and
relationships among factors; functional
and conceptual.
i) Functional. Input/Output-based, tracking relationships among
variables, e.g., storm runoff prediction.
Characteristics include cause/effect linkages, hard science and
sensitivity analysis.
ii) Conceptual. Perception-based, incorporating both fact interpretation and value weights, e.g., suitability for outdoor recreation. Characteristics include heuristics (expert rules), soft science and scenarios.
3) Types of GIS
Models: Cartographic and Spatial
a)
Cartographic. Automation of manual
techniques that traditionally use drafting aids and transparent overlays,
e.g., a map identifying locations of productive souls and gentle slopes using
binary logic expressed as a geo-query.
b)
Spatial. Expression of mathematical relationships among map
variables, e.g., a map of surface heating based on ambient temperature and
solar irradiance using multivalue logic expressed as
variables, parameter and relationships.
4) GIS Model
Characteristics: Scale, Extent,
Purpose, Approach, Technique, Association and Aggregation
a)
Scale. Micro and Macro
i) Micro. Contains high resolution of
space, time and/or variable considerations governing system response, e.g., a 1;1,000 map of a farm with crop specified for each individual
field revised each year.
ii) Macro. Contains low
resolution of space, time and/or variable considerations governing system
response, e.g., a 1;1,000,000 map of land use with a
single category for agriculture revised every 10 years.
b)
Extent. Complete and Partial
i) Complete. Includes entire set of space, time and/or variable considerations
governing system response, e.g., a map of an entire watershed or river basin.
ii) Partial. Includes subsets of space, time and/or variable considerations
governing system response, e.g., a standard topographic sheet with its
“artificial boundary” capturing limited portions of several adjoining
watersheds.
c)
Purpose. Descriptive and Prescriptive
i) Descriptive.
Characterization of the direct interactions of system components to gain
insight into system processes (understand), e.g., a wildlife population
dynamics map generated by simulation of life/death processes.
ii) Prescriptive.
Characterization of the direct and indirect factors related to system
response used in determining appropriate management actions (decide), e.g., a campground suitability map based on interpretation of
landscape features.
d)
Approach. Empirical and Theoretical
i) Empirical. Based on reduction (analysis) of field collected measurements,
e.g., a map of soil loss for each watershed in a region generated by spatially
evaluating the Universal Soil Loss Equation.
ii) Theoretical. Based on linkage (synthesis) of proven or postulated relationships
among variables, e.g., a map of spotted owl habitat based on accepted theories
on owl preferences.
e)
Technique. Deterministic and Stochastic
i) Deterministic. Direct
evaluation of a defined relationship (results in a single repeatable solution),
e.g., a wildlife population map based on one model execution using a single
“best” estimate to characterize each variable.
ii) Stochastic. Simulation of
a probabilistic relationship (results in a range of possible solutions), e.g.,
a wildlife population map based on the average of a series of model executions
using probability functions to characterize each variable.
f)
Association. Lumped and Linked
i) Lumped. The state/condition of each
individual location is independent of
other map locations (point-by-point).
ii) Linked. The state/condition
of an individual location is dependent of
other map locations (vicinity, neighborhood or regional).
g)
Aggregation. Cohort and Disaggregated
i) Cohort. Executed for
groups of objects having the same
characteristics, e.g., a timber growth map for each management parcel based on
a look-up table for growth for each specific set of landscape conditions.
ii) Disaggregated. Executed for
each individual object, e.g., a map
of predicted biomass based on spatially evaluating a regression equation in
which each input map identifies an independent variable, each location a case
and each value a measurement (usually raster-based grid cells).
h)
Temporal. Static and Dynamic
i) Static. Treats time as a constant, and
model variables do not vary over time,
e.g., a map of timber value based in forest inventory and relative access to
existing roads.
ii) Dynamic. Treats time
variable and model variables change as a
function of time, e.g., a map of the spread of pollution from a point
source.
_____________________
Author's Note: The next
section translates the outline into a generalized Classification Guide for GIS
Models. Sound like fun, or more
pedagogical pomposity?
Dodge the GIS Modeling Babble Ground
(GIS World, February 1995)
As you may recall from the previous section, there
are many dimensions to GIs modeling.
Modeling is as personal as the underwear you buy or the politics you
support. GIS modeling perspectives are
the result of the data you keep and the things you do. A county clerk, city engineer, forester and
market forecaster work with radically different data for many diverse
purposes. In the applied arena, GIS
modeling mean different things to different people— hence the “babble-ground”
lines are drawn in the sands of confusion.
If you strip away the details of specific of
specific applications, however, common threads appear among the GIS models
themselves and the modeling processes undertaken. The previous section attempted to capture
some of the more important threads. The
factors discussed are stripped of their verbiage and summarized in the
classification guide shown in figure 1.
Figure 1. Guide
identifying the types and characteristics of GIS Models.
One of
the most frustrating aspects of any classification scheme is being forced to
assign something to one of two choices (binary logic). It’s like those dumb questions on the
Scholastic Aptitude Test— not everything is black and white. In the classification guide the descriptors
for each factor identify opposing extremes.
The dots separating the extremes provide a range of possible responses—
you simply place an “X” at the appropriate spot along the continuum. The dichotomies have been arranged so a
clustering of marks toward the left indicate models that are easier to
comprehend without a Ph.D. in complex studies.
Let’s tackle
an easy example and force responses to the extremes. Consider Michelangelo’s sculpture of Venus de
Milo. Sure it’s a model (abstraction),
or she sure has us all fooled by sitting so still. Within the limits of the classification
guide, falls into the following categories:
·
Material (one
big piece of marble; no abstract symbols here)
·
Structural (model
characterizes her construction; don’t know about her relationships)
·
Object
(visual rendering of just her; no moveable parts)
Granted,
she’s not a GIS model. If she was,
however, she could be categorized as follows:
·
Cartographic
(manual techniques; no wimpy mathematics)
·
Micro (about
a 1:1 scale; unless she’s a scaled version of Goliath’s mom)
·
Partial
(missing arms and legs; or maybe they were nicked in a move)
·
Descriptive (wow
and how; doesn’t tell you what to do …she’s just a rock)
·
Empirical
(direct measurement; or Mickey A had an active imagination)
·
Deterministic
(direct, single solution; hips and shoulders have no chance of being attached
elsewhere)
·
Linked (the
hip bone is attached to the thigh bone…; can’t talk about her chin without
noticing her eyes)
·
Disaggregated
(one-of-a-kind; though millions strive for a favorable comparison)
·
Static (hasn’t changed for centuries;
the whole effect is dynamite, but not dynamic)
Now
let’s try a tougher one: an animated set of maps predicting wildfire growth for
hourly time steps. Figure 2 indicates
“refined” response positioning along each of the scales, whereas the following
discussion identifies the extremes.
The first
part is easy, as the fire model leans toward the following categories:
·
Abstract (or
you had better get a hose)
·
Relational
(depends on several mappable factors, including terrain, vegetation
type/condition and weather)
·
Functional
(mostly uses fire science research tracking the relationships among variables)
The
more perplexing part the following GIS model type and characteristics:
·
Spatial (a lot
of math behind this one)
·
Micro
(considers only the fire front and its immediate surroundings)
·
Partial (until
the fire is extinguished)
·
Descriptive
(unabated fire propagation without fire management actions)
·
Empirical (based
on field-calibrated equations)
·
Deterministic (based
on a defined set of input parameters)
·
Linked (adjacent
parcels next)
·
Disaggregated (independently
considers each burning location and its propagation options)
·
Dynamic
(diurnal and ongoing fire behavior change model variables)
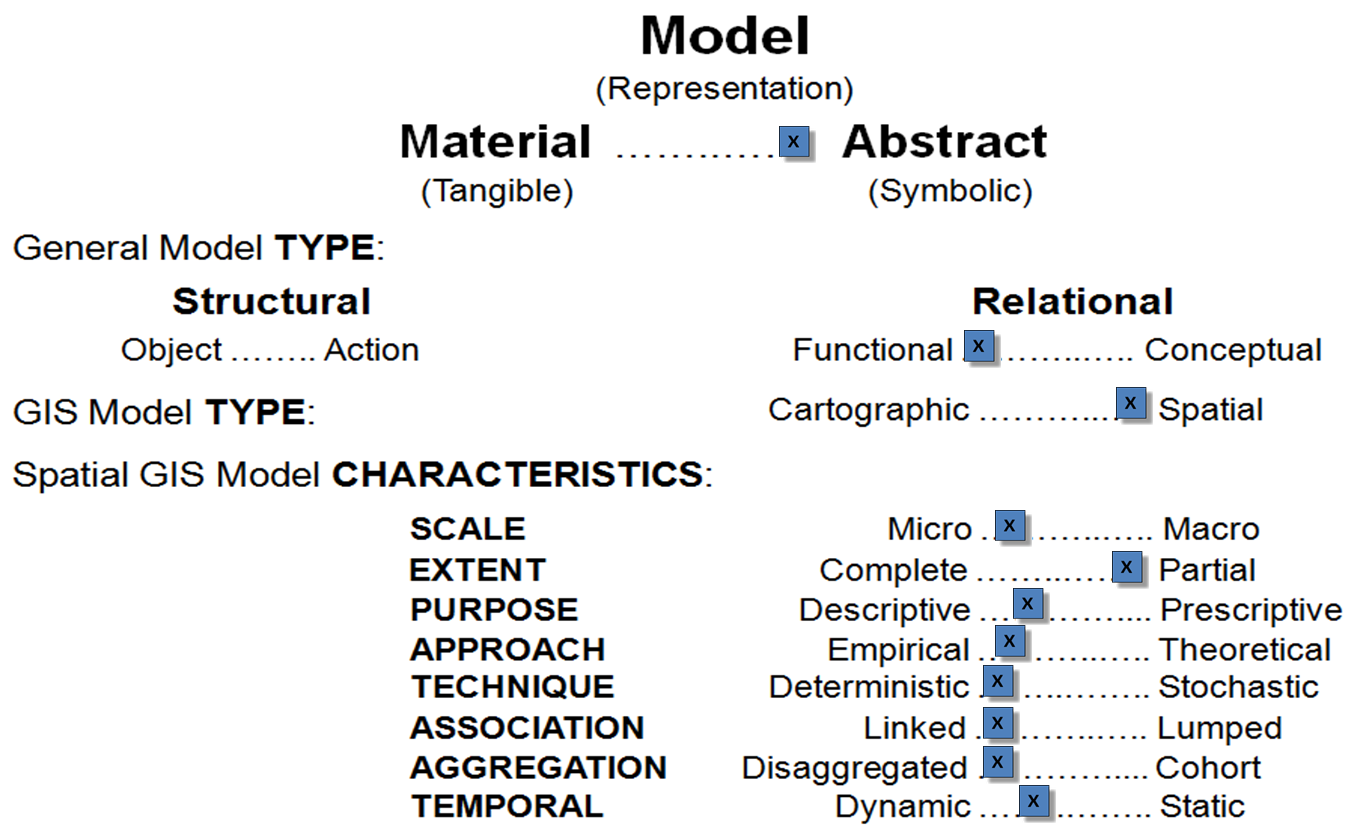
Figure 2. Categorization of a GIS model generating an animated set of maps predicting wildfire movement.
Whew! Now try your hand at “classifying” the
following representations of reality and/or your own favorite GIS models:
-
Mount Rushmore’s faces of the presidents
-
A landscape architect’s cardboard model
of a nation park
-
An elk habitat model
-
A set of seasonal maps of elk habitat
-
An elk population dynamics model responding
to landscape conditions and predator/prey interactions
-
A GIS implementation of the Universal
Soil Loss Equation for a watershed
-
A GIS implementation of the Horton
Overland Flow Equations evaluating surface water runoff for a set of watersheds
-
A crop yield prediction map
-
A set of maps of wildfire risk generated
each morning
-
A dynamic wildfire growth model
responding to temperature fluctuations, complex wind vectors and fire abatement
actions
Enjoy!
_____________________
Author's Note: A classic
reference for modeling is Mathematical Modeling with Computers, by Jacoby and Kowalik, Prentice-Hall, 1980. Ample “poetic license” was used in extending
the basic modeling framework to the unique conditions and approaches used in
GIS modeling.
From Layers to Tapestry
(GeoWorld, February 1995
Supplement)
Most
people agree that there are three essential elements to GIS: data, operations, and
applications. To use the technology you need a bunch of digital maps, an
analytic "engine" to process the maps, and interesting problems to
solve. However, there are different
views regarding the relative importance of the three elements. Some people have a data-centric perspective, as they prepare individual data layers
and/or assemble the comprehensive databases GIS needs. Other people are operations-centric, because they lock in on refining and expanding
the GIS toolbox of processing and display capabilities. Finally, the applications-centric folks see the portentous details of data and
operations as mere impediments to problem solving. Such is the fractious fraternity of GIS.
In
the early years, the data and operations orientations dominated the developing
field. As GIS matured, the focus shifted
to applications. As a result, more
attention is directed toward the assumptions and linkages that are embedded in
GIS models—map analysis solutions to pressing problems. In essence, we're weaving our data layers
into complex, logical tapestries of map interrelationships. A crucial component of this evolution is an
effective mechanism to communicate model logic, as well as processing flow.
Programmers
and system analysts routinely use diagramming techniques for communicating
data/processing flow. Various approaches
include structure and flowcharts, as well as data flow, entity relation,
control flow, and state transition diagrams.
Each technique invokes a subtly different perspective in communicating
structure and logic. For example, a data
flow diagram emphasizes the processing steps used in converting one data set
into another (figure 1). The technique
uses large circles to symbolize operations, with the lines connecting the
operations identifying the data layers (input and output) used in each
processing step. Its design draws one's
attention to the processing steps over the data states, thereby best serving an
operations-centric orientation.
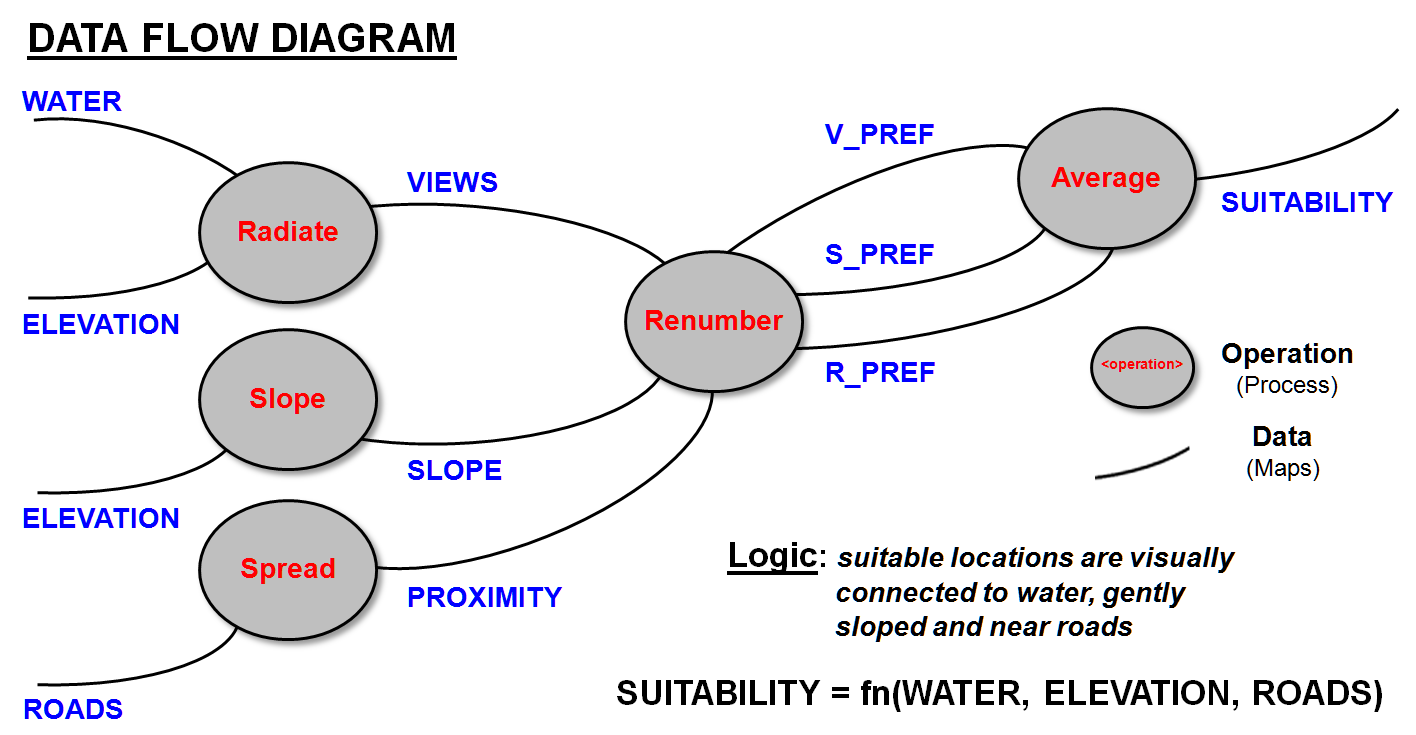
Figure 1. Example of a Data Flow Diagram
emphasizing the processing steps used in converting one data set into another
(Lines= processing; Ovals= maps).
Processing-oriented
diagrams work well for nonspatial information processing. They relate data about entities through
indexed files. In these instances, the
specifications in a database query are paramount. Instances of geo-query, such as "Where
are all the locations that have slopes greater than 13 percent AND unstable
soils AND are devoid of vegetation?" use standard database management
systems technology. In such instances,
standard diagramming techniques are most appropriate.
However,
spatial analysis techniques go beyond repackaging existing data. For example, it's a different story if you
want to establish variable-width buffers around salmon spawning streams. You simultaneously need to consider
intervening slopes, ground cover, and soil stability as you "measure"
distance. If you want to establish a map
of visual exposure density to roads, you need to consider maps of the road
network and relative elevations at a minimum.
These, and myriad other spatial analysis procedures, have strong data
dependency. They aren't just setting a
few parameters for traditional, nonspatial processing techniques. Spatial analysis is a new kettle of fish as
it is dependent on the unique geographic patterns of the data sets involved—
definitely data-centric conditions.
As
introduced in previously (Topic 1), a GIS model flowchart, or "map
model," takes such a perspective.
The top of figure 2 uses a flowchart to track the same data/processing
steps as shown in the data flow diagram.
Maps (i.e., data sets) are depicted as boxes, and operations (i.e., processing
steps) are depicted as arrows.
Obviously, this focus is data-centric because it draws your attention to
the mapped variables.
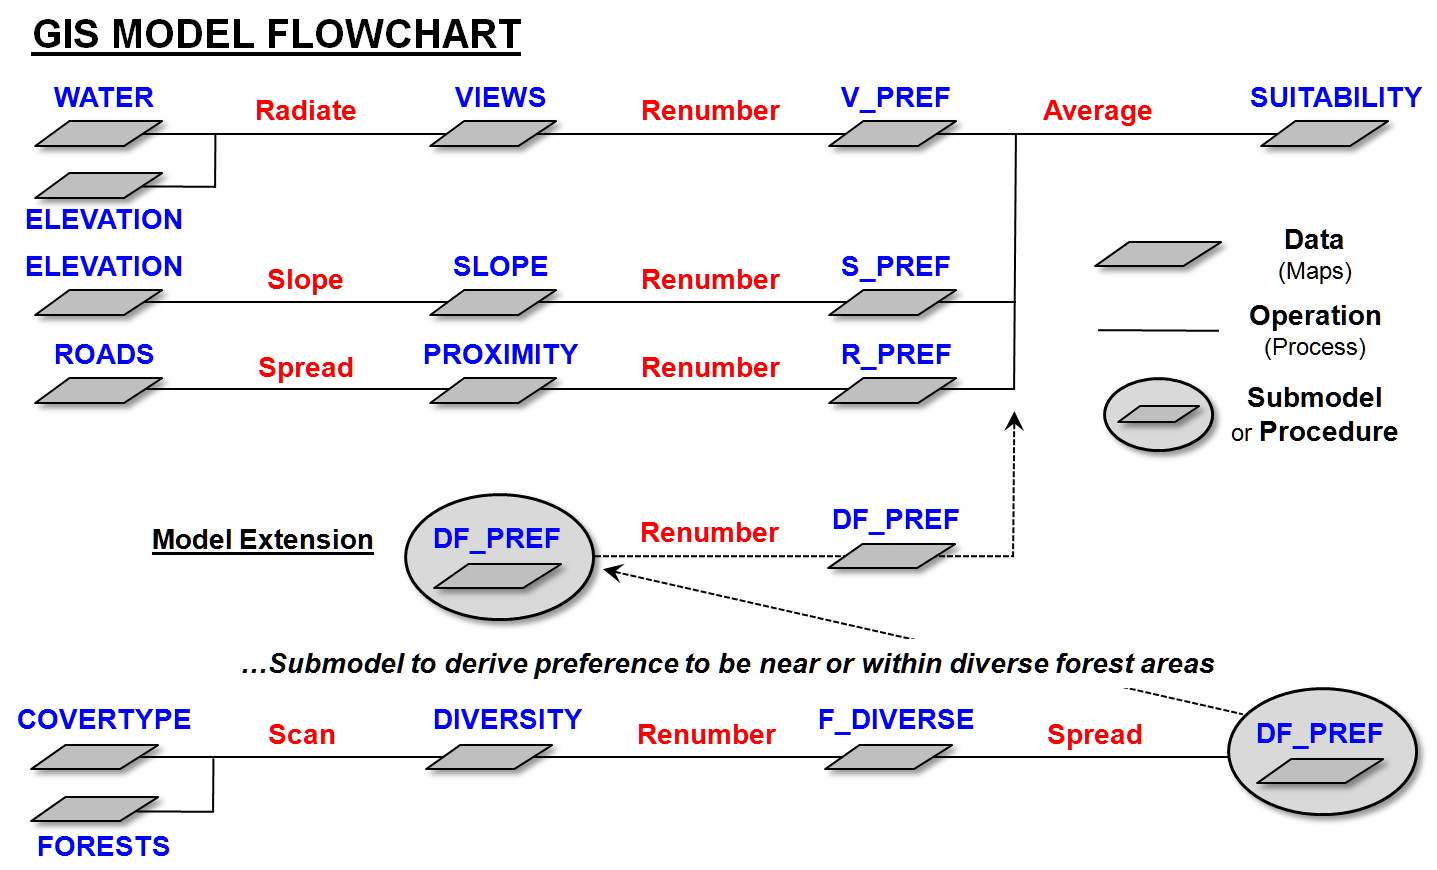
Figure 2. Example of a GIS Model Flowchart where maps (i.e., data sets) are
depicted as “floating boxes” and operations (i.e., processing steps) are
depicted as lines.
Arguably,
it's also applications-centric. Most GIS
users have experience with manual map analysis techniques. They've struggled laboriously with rulers,
dot grids, and transparent overlays to draft new maps that better address a
question at hand. For example, you may
have circled areas where the elevation contour lines are close together to
create a map of steep slopes. In doing
so, attention is focused on the elevation data and the resultant circles
inscribed on the transparent overlay— the input and output maps.
The
bottom portion of figure 2 shows a logic modification incorporating a
preference to be near or within diverse forested areas. A neighborhood operation (scan) assigns the
number of different vegetation types (Covertype)
within the vicinity of each forested location (Forest). Areas of high diversity are isolated (renumber),
and a proximity map from these areas (df_prox) is generated for the
entire project area. Because several
models might share this command set, it's stored as a generalized procedure and
is attached using the SubModel
or Procedure flowcharting "widget."
Figure
3 identifies an interactive construction of a processing modification to the
model. In this example, a display of the
Suitability map with road vectors
(Road.bln) graphically overlaid is
used as a backdrop for the user to manually draw a potential set of Suitable sites. Statistics on the sites (Stats.tbl) are presented, and the user
can either accept them or redraw another set of potential sites. When accepted, the raster map is converted to
vectors and stored. The example uses an
extended set of Connector, File, Manual Operation, Conditional
Branch and Nonspatial Operation
widgets in a manner similar to constructing a schematic in AutoCAD.
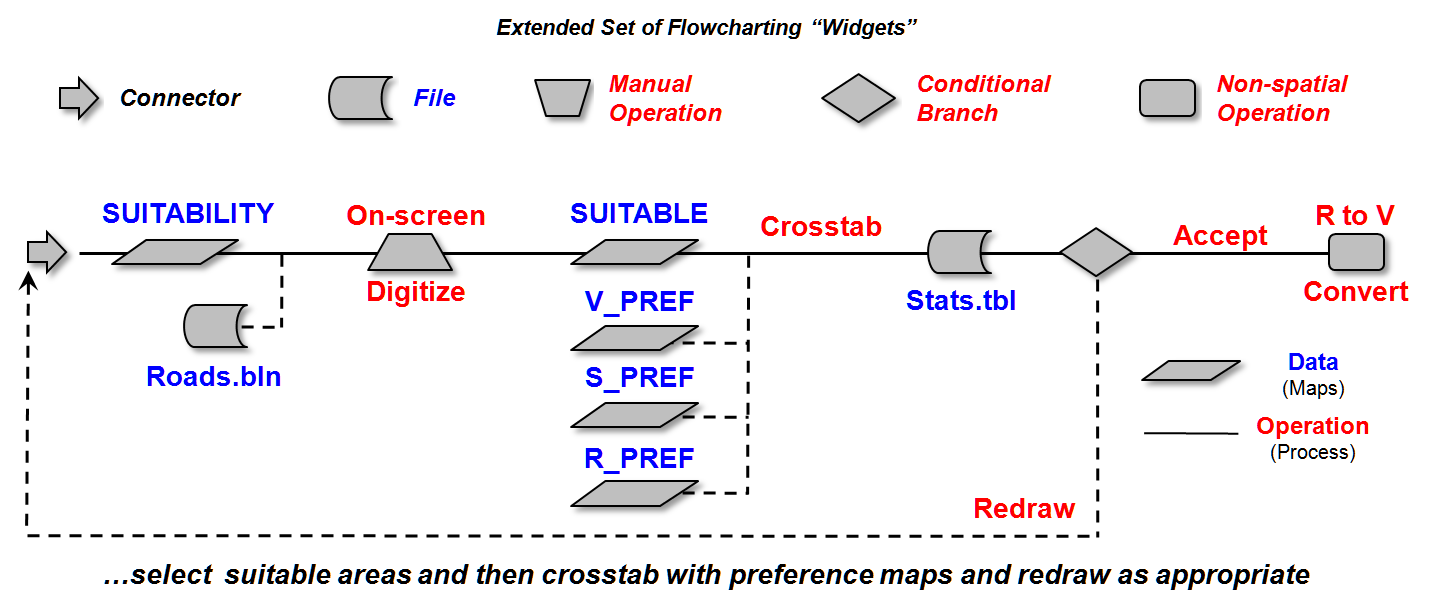
Figure 3. Interactively modifying a “live” GIS flowchart using graphic
widgets similar to constructing a schematic in AutoCAD.
So
what? All that discussion about click-to-construct a model’s logic seems
to be "much ado about nothing."
It's just a bunch of globs, lines, and silly symbols.
Actually,
it might be the best way for GIS to get out of the black box and into the light
of creative applications. General users need
a simple flowchart of model logic to understand and appropriately apply a
model. A more complex flowchart
extending to processing flow is needed by the GIS specialist who wrestles with
the actual code. What we all need is a
single diagramming technique that can operate at both levels-a simple logical
expression that can be embellished with processing flow details.
Heck,
in the not too distance future the GIS processing code (command macro) will be
generated automatically— simply draw a GIS model’s logic and the command file
needed to execute it will be created on-the-fly. Clicking on a line will pop-up the command’s
dialog box enabling you to you edit it and run a different scenario. Awesome!!!
_____________________