![]()
Carleton College — Environmental and
Technology Studies
Intensive Workshop
Grid-based Map Analysis Techniques and
<click> for printer-friendly version of this
document (.pdf)
Infusing Grid-based Map
Analysis into Teaching
…participants
will adapt/develop map analysis demonstrations and hands-on exercises for use
in their own courses. Friday, March
21, 2008, 9:00 am to 12:00 pm (optional extension into the afternoon).
Below
are some ideas for projects …it is likely other ideas will surface during the presentations and
discussions on Wednesday and Thursday; also, many of the projects could be
implemented for local data sets. The
examples are organized into two groups—GeoExploration emphasizing map visualization
(more humanities-oriented) and GeoScience emphasizing map analysis (more
science-oriented).
GeoExporation (map visualization emphasis)
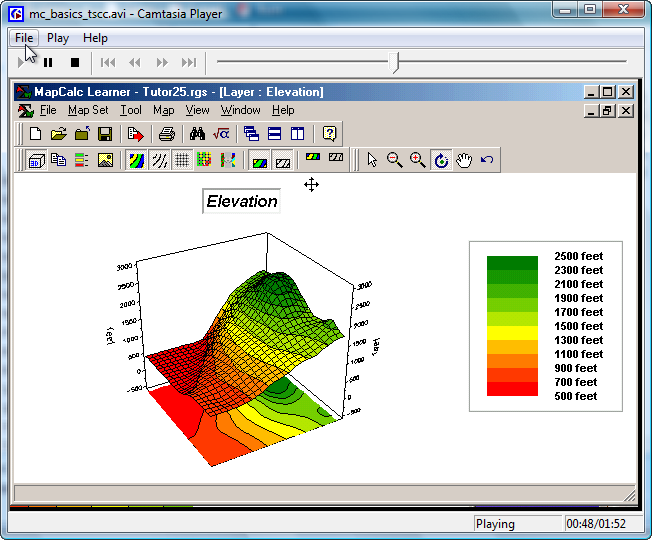
1) Exercise
to produce Training Videos of computer processing. Use SnagIt to produce videos of
computer processing steps that can apply to any computer exercise (not
GIS-specific). For example…
 click MapCalc
Basics
to run a
SnagIt video demonstrating some of the basic MapCalc display and map handling
features.
click MapCalc
Basics
to run a
SnagIt video demonstrating some of the basic MapCalc display and map handling
features.
 click MapCalc Basics to run a SnagIt video demonstrating
some of the basic MapCalc display and map handling features.
click MapCalc Basics to run a SnagIt video demonstrating
some of the basic MapCalc display and map handling features.
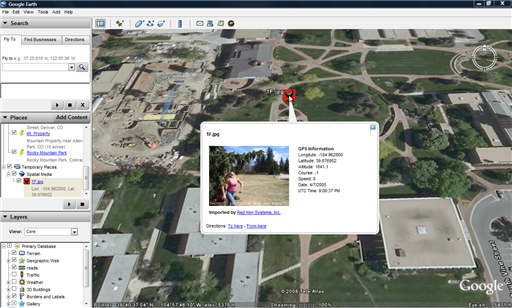
2) Exercise
to produce Multimedia Maps linking photos and maps. Carry a GPS and take field photos of campus
and then use MediaMapper to automatically geo-register the photos to a
HTML map and Goggle Earth display of the area.
[see http://www.redhensystems.com/]
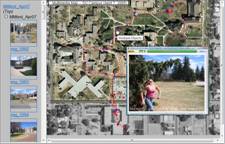
HTML Webpage
Goggle Earth Display
3) Exercise
using Google Earth to visualize the globe and stars. Use Google Earth to develop “tours” that
coincide with class lectures, such as locations where the French Impressionist
painters practiced their craft.
[see http://earth.google.com/]
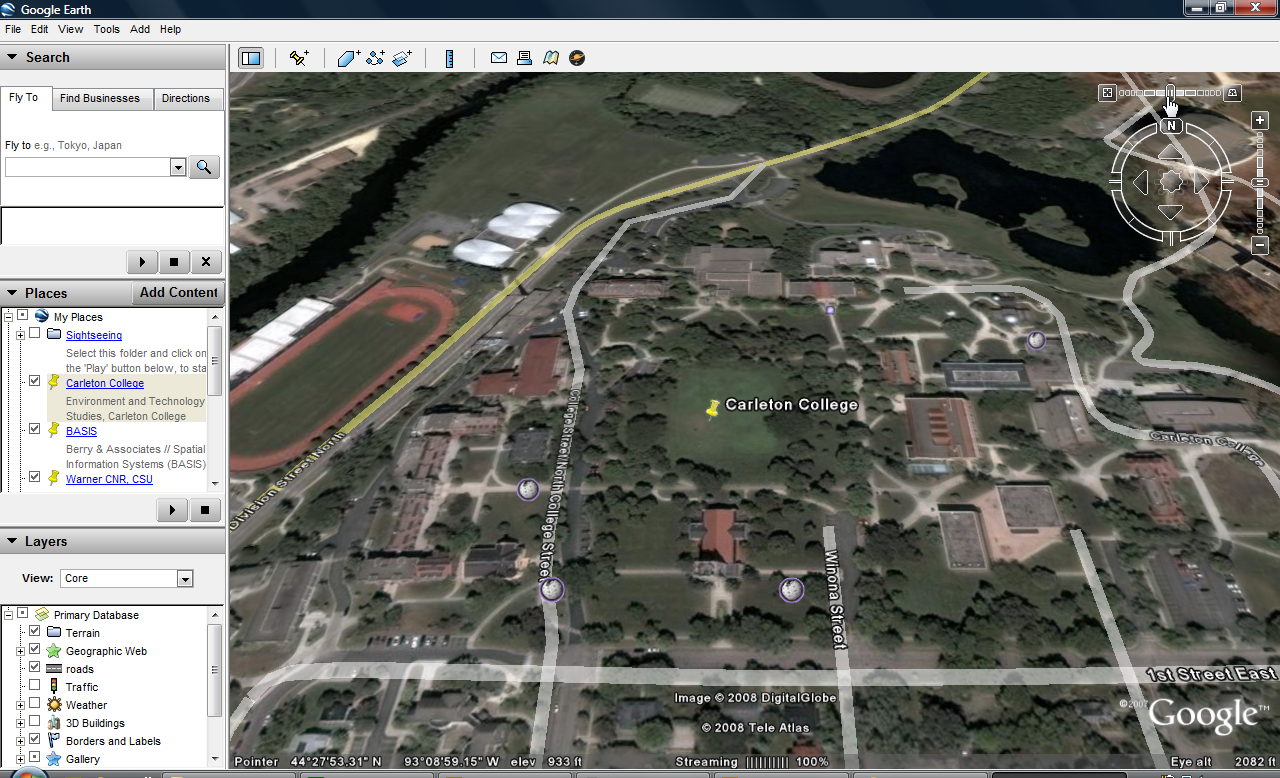
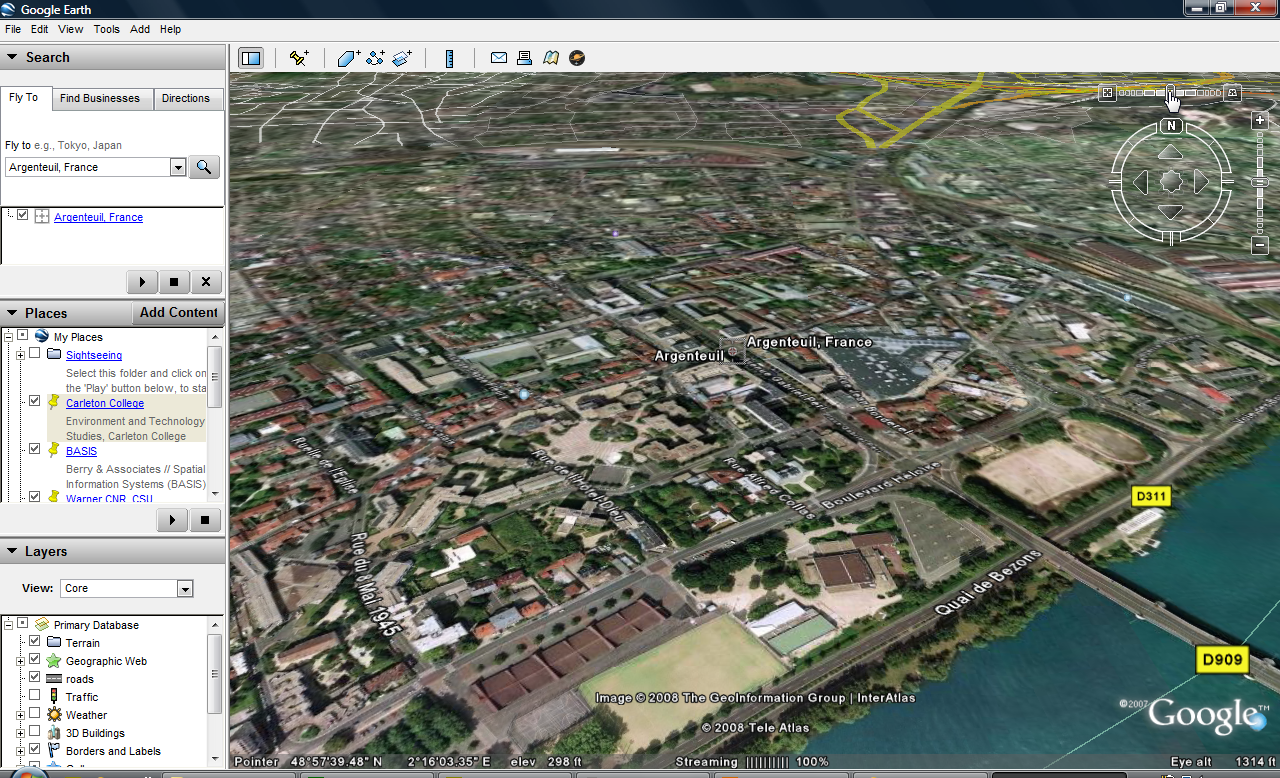
GE display of Carleton College GE
display of Argenteuil, France (Monet)
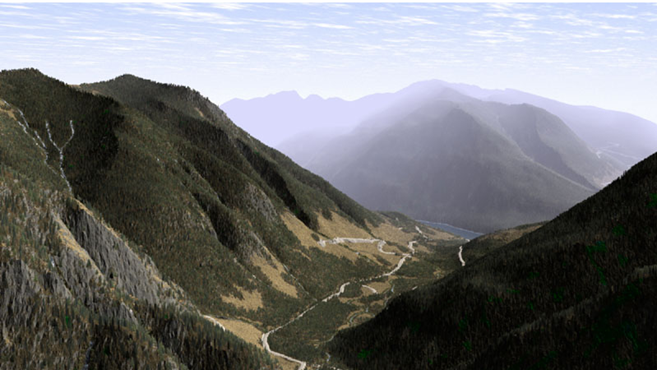
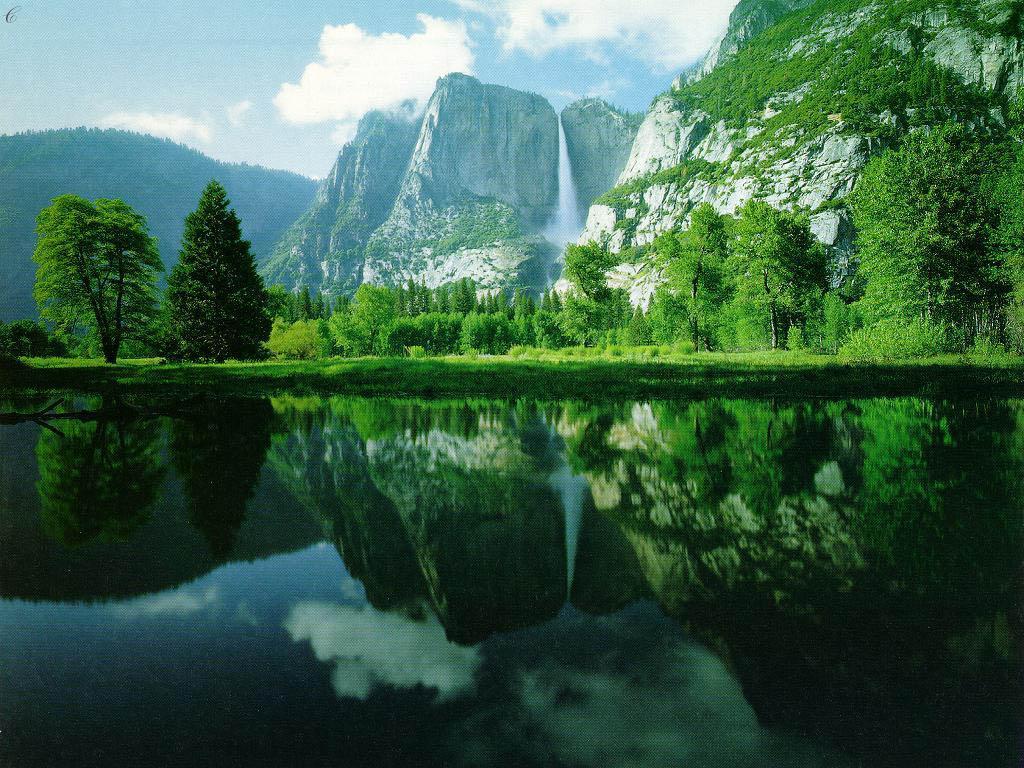
4) Exercise
demonstrating GIS-based Virtual Reality to visualize
landscapes. Investigate the applications
gallery for 3D visualization of landscapes generated using 3D Nature’s Visual
Design Studio software linked to GIS data bases. Prepare an exercise that illustrates the thin
line between “Reality and Fantasy” and how spatial technology can be both a
benefit and a curse for student discussion of the social, cultural and moral
impacts of Geotechnology (cyber-liberation versus geo-slavery).
[see http://3dnature.com/]
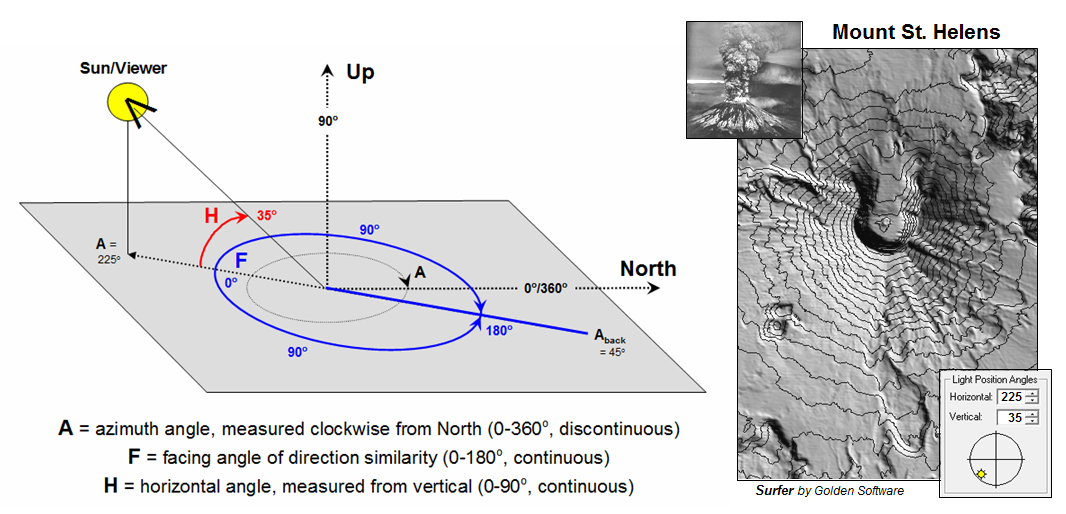
5) Exercise
investigating Hillshade and Insolation Indices. Use Surfer and terrain data (DEM) to
demonstrate terrain effects on the amount of solar energy per unit area
throughout a project area. One can
download DEM data for anywhere in the continental
[see http://www.innovativegis.com/basis/MapAnalysis/Topic11/Topic11.htm#Hillshade]
GeoScience (map analysis emphasis)
6) Exercise
investigating Spatial Interpolation and Surface Mapping. Use Surfer and an inexpensive handheld
GPS unit to collect spatially-aware data, such as elevation (Lat, Lon,
Altitude) for an open space on campus with rolling terrain.
[see http://www.innovativegis.com/basis/MapAnalysis/Topic2/Topic2.htm]
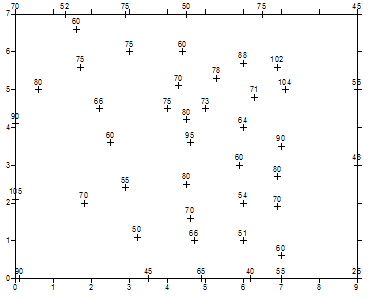
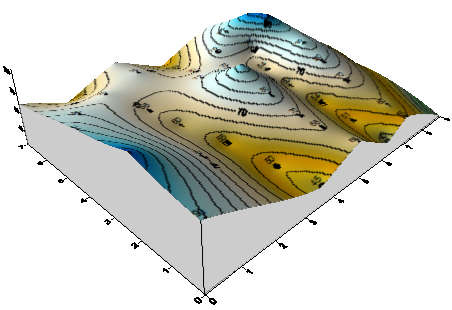
Another
possibility is to collect environmental data (Lat, Lon, Value) to create an
abstract map surface, such as soil chemistry concentration or estimated
vegetation density of forbs per meter plot sampling. Both exercises provide a good exposure to
spatial sampling design concepts.
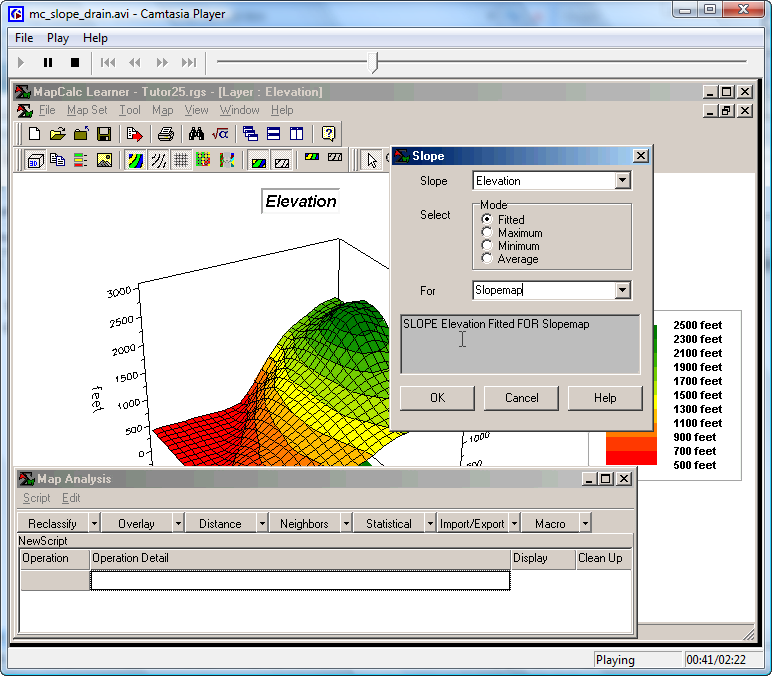
7) Exercise
investigating Micro-Terrain Configuration. Use MapCalc to calculate slope,
aspect, roughness, and configuration (convex/concave features). Terrain complexity has a significant effect
on surface water flows and retention for vegetation use.
[see http://www.innovativegis.com/basis/MapAnalysis/Topic11/Topic11.htm]
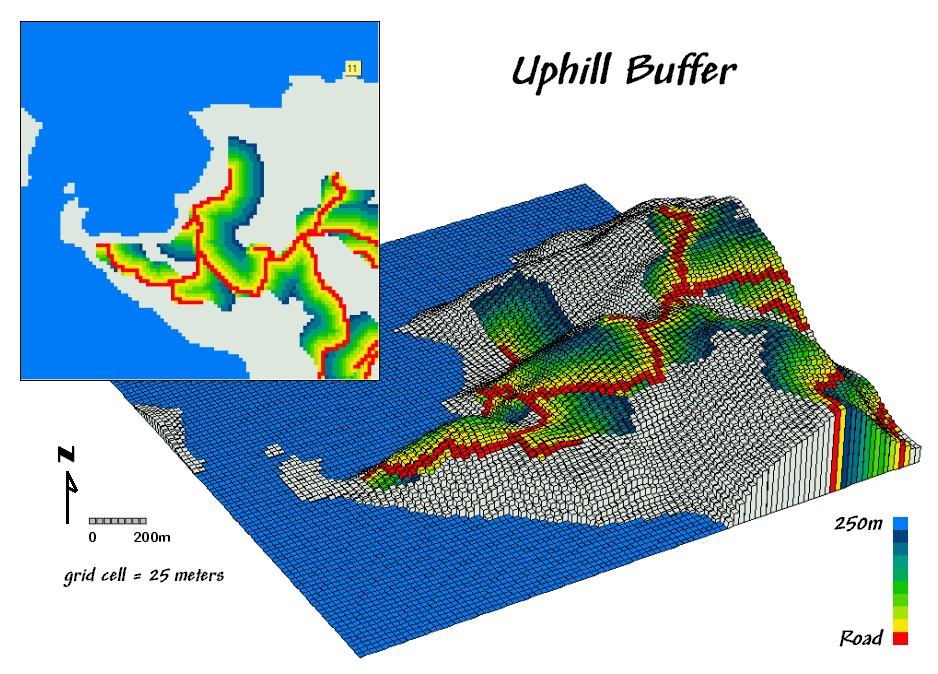
8) Exercise
investigating Variable-width Buffers based on Effective Proximity. Use MapCalc to generate variable-width
buffers, such as an uphill buffer from roads or a sediment loading buffer set
around streams considering, slope, vegetative cover and soil type. The use of simple-distance buffers of a fixed
reach is often too simple to be useful.
For example, a fixed distance buffer around streams often fail to
protect them in areas of high erosion potential and often over-reach in areas
of minimal erosion potential—effectively accounting for both environmental and
economic interests require resource professionals to toss out the Euclidian
distance paradigm along with their straightedge rulers.
[see http://www.innovativegis.com/basis/MapAnalysis/Topic13/Topic13.htm
and
http://www.innovativegis.com/basis/MapAnalysis/Topic24/Topic24.htm]
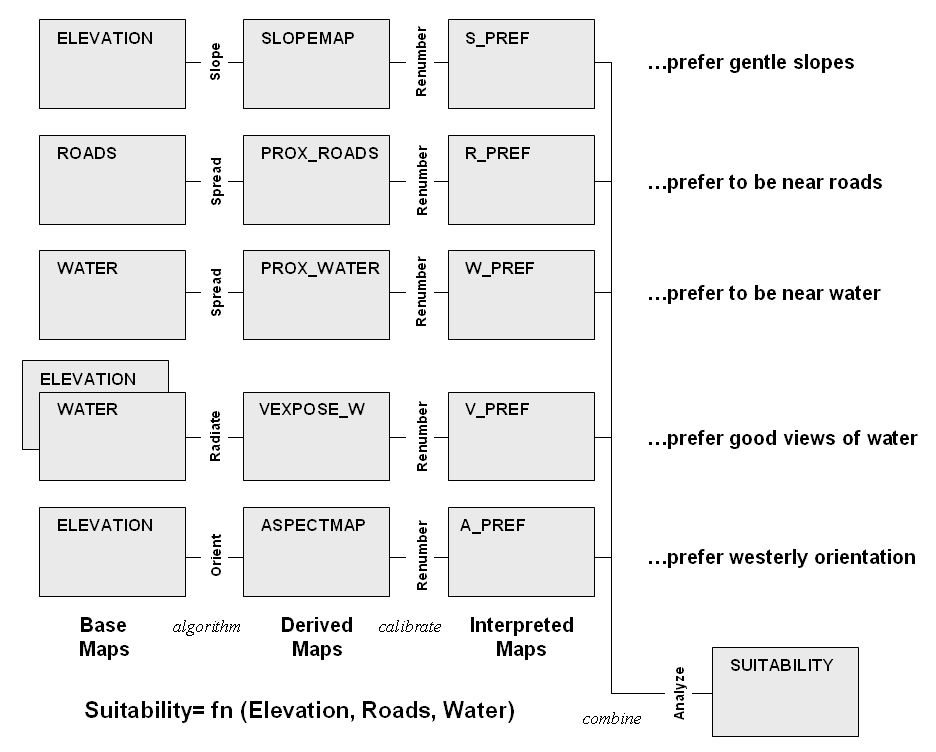
9) Exercise
investigating Campground Suitability Modeling. Use MapCalc to create, implement and
refine a suitability model assuming that the most preferred areas for a
campground are Gently Sloped, Westerly Oriented, Near Roads, Close to Water and
have Good Views of water. Extend the
analysis to include a preference to be In or Near Forests, as well as
generating and comparing three separate scenarios that reflect the relative
weighting of different recreation groups.
A related exercise might investigate Habitat Suitability modeling—people
and animals, we all have our preferences.
[see http://www.innovativegis.com/basis/MapAnalysis/Topic23/Topic23.htm]
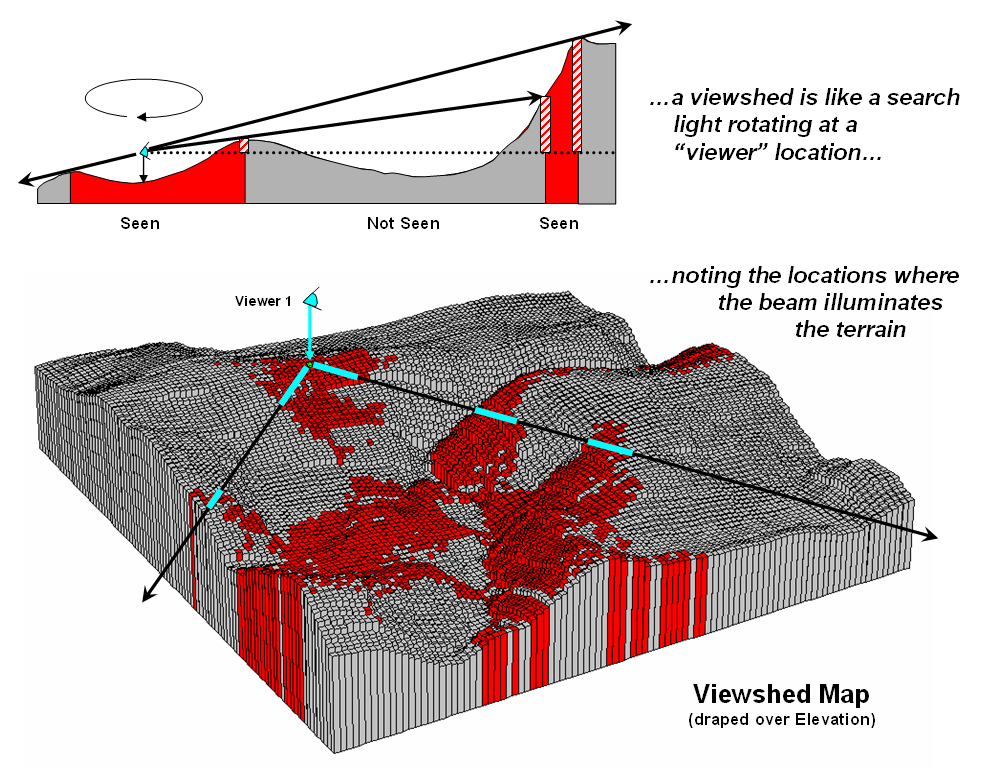
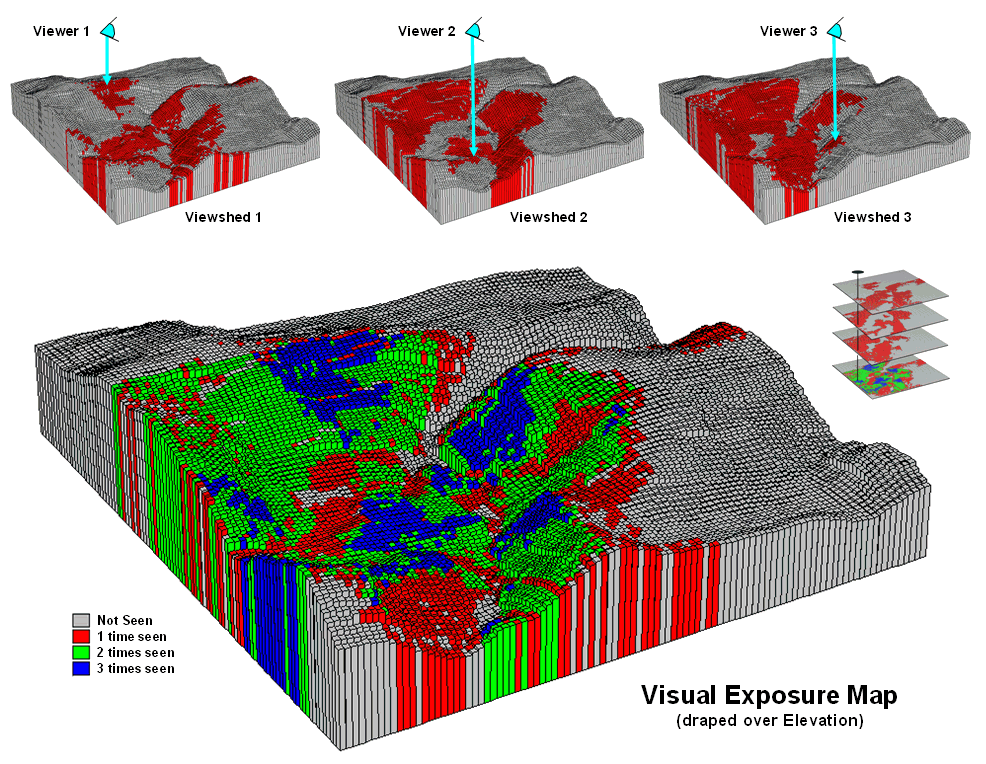
10)
Exercise investigating Viewshed and Visual Exposure Analysis. Use MapCalc to generate Viewshed,
Visual Exposure, Weighted Visual Exposure and Visual Vulnerability maps. Use these maps to assess the visual impact of
proposed development alternatives.
[see http://www.innovativegis.com/basis/MapAnalysis/Topic15/Topic15.htm]
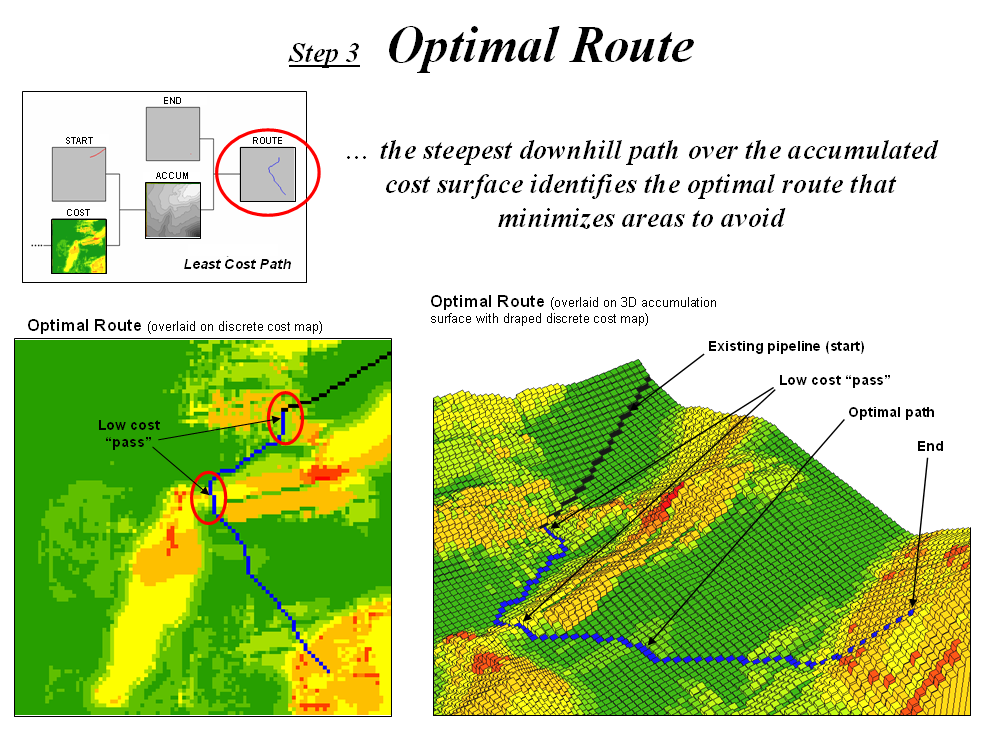
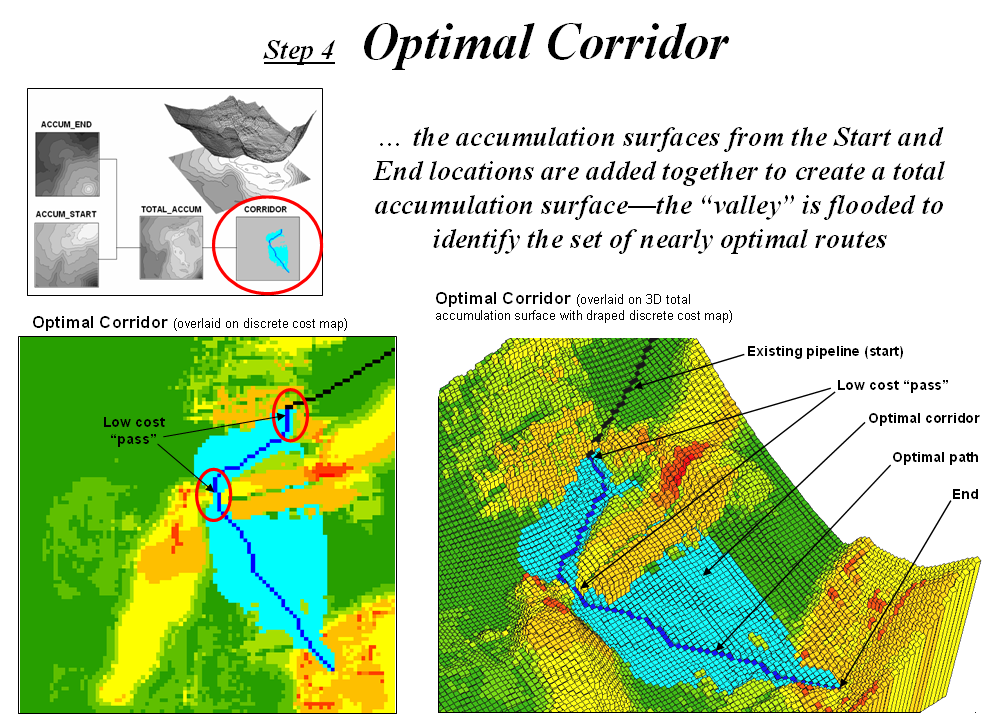
11)
Exercise investigating Optimal Routing. Use MapCalc to determine them optimal
route and corridor for a power line considering relative preferences of
avoiding areas of High Housing Density, Far from Roads, In or Near Sensitive
areas and have High Visual Exposure to Houses.
Extend the analysis to include a preference to be in Open Areas or along
Forest edges, s well as generating and comparing three separate scenarios that
reflect the relative weighting of different recreation groups.
[see http://www.innovativegis.com/basis/MapAnalysis/Topic15/Topic15.htm]
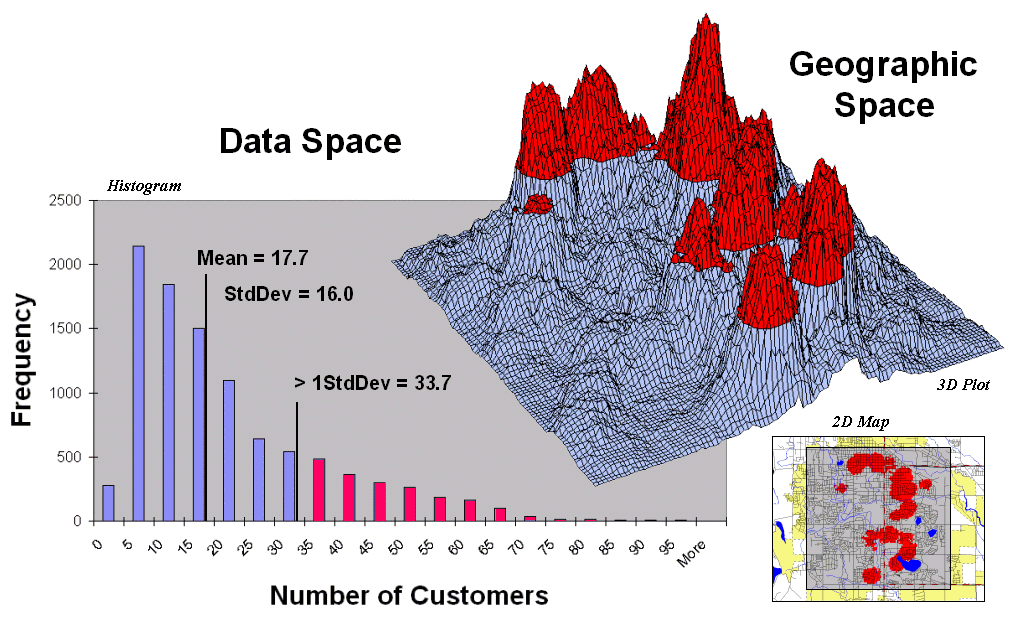
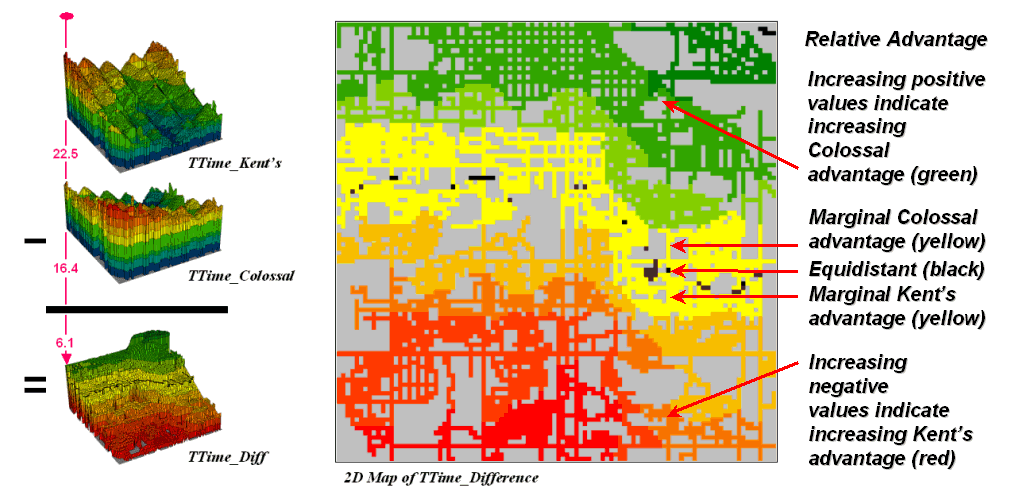
12)
Exercise investigating Retail Competition Analysis. Use MapCalc to generate customer
density surface and isolate pockets of unusually high concentrations. Extend the analysis to determine relative
travel-time from two stores and derive their combat zone” with minimal
travel-time advantage for either store.
[see http://www.innovativegis.com/basis/MapAnalysis/Topic17/Topic17.htm]
13)
Exercise investigating Crop Yield Mapping and Analysis. Use MapCalc to analyze the spatial
patterns and relationships of crop yield that occur throughout a farmer’s field
focusing on procedures for map surface normalization and comparison of relative
yield within a field (univariate/descriptive statistics focus).
[see http://www.innovativegis.com/basis/MapAnalysis/Topic16/Topic16.htm]


14)
Exercise investigating Map Similarity and Field Clustering. Use MapCalc to analyze the spatial
patterns and relationships among mapped data layers focusing on procedures for
map similarity and grouping of similar data patterns (multivariate/prescriptive
statistics focus).
[see http://www.innovativegis.com/basis/MapAnalysis/Topic16/Topic16.htm]

