Ironing Out
Planimetric versus Surface Area Calculations
Paul Sutton, Associate Professor, Geography,
Mario Lopez, Associate Professor, Computer Science,
Last month’s Beyond Mapping column (GeoWorld,
December 2002, see link below) on the difference between planimetric and
surface area got us thinking—what would be the shape of
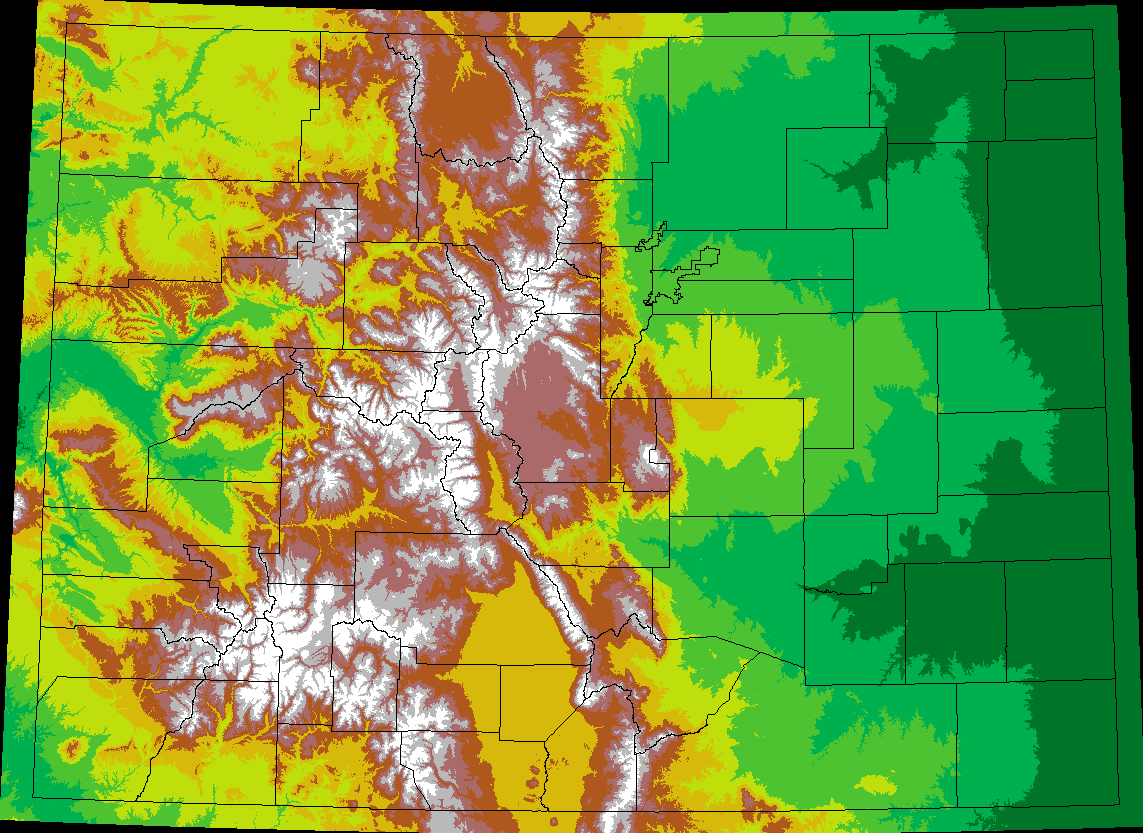
Figure 1 is a display of the
readily available 90 meter DEM data for the state. The green tones identify lower elevations of
the eastern plains and western slope that transition to white areas of the
The next step calculates the
surface area for each 90 meter grid based on the location’s slope using the
equation…
Surface
Area = (90m)2 / cos(slope angle)
…and expressed as SurfArea = int(PlanArea / cos(SlopeGrid div
deg) in ArcGIS.
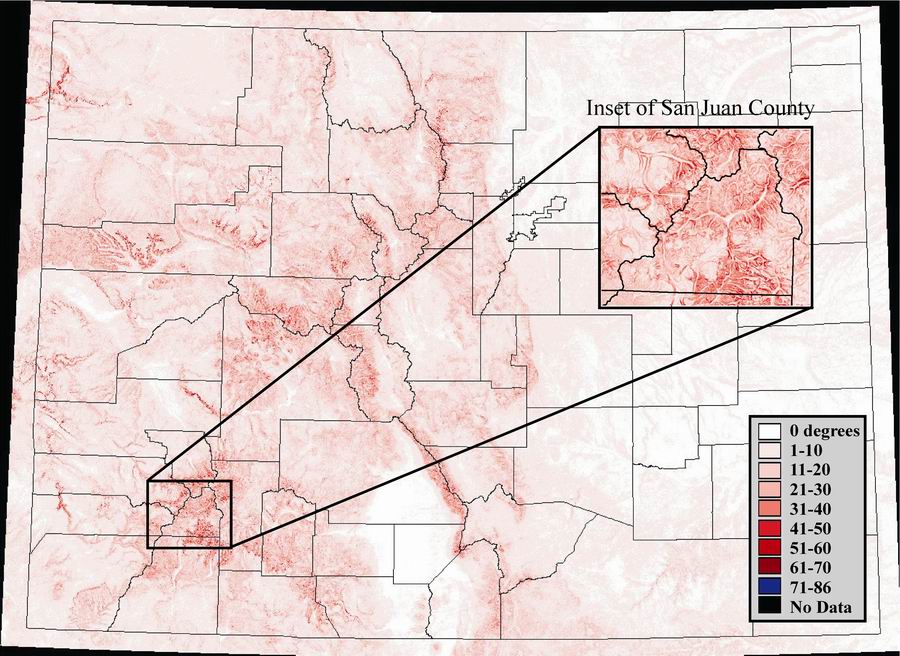
Figure 2 shows the results
for the surface area calculations with white indicating 0 degrees (no change in
area) through dark red for 86 degrees (tremendous change). The calculation for this extreme condition is
grid cell area / cosine (slope angle)= .81ha2 / cosine (86)= 11.6ha2. Note that the biggest changes are in the
mountainous areas as you would expect.
Also note what appears to be a relationship between county boundaries
and large changes (steep areas)—very interesting.
The final step summarizes the
results for each county using the region-wide summary command (Summarize Zones in ArcView).
This procedure calculates the average percent change for each of the
sixty-five counties in
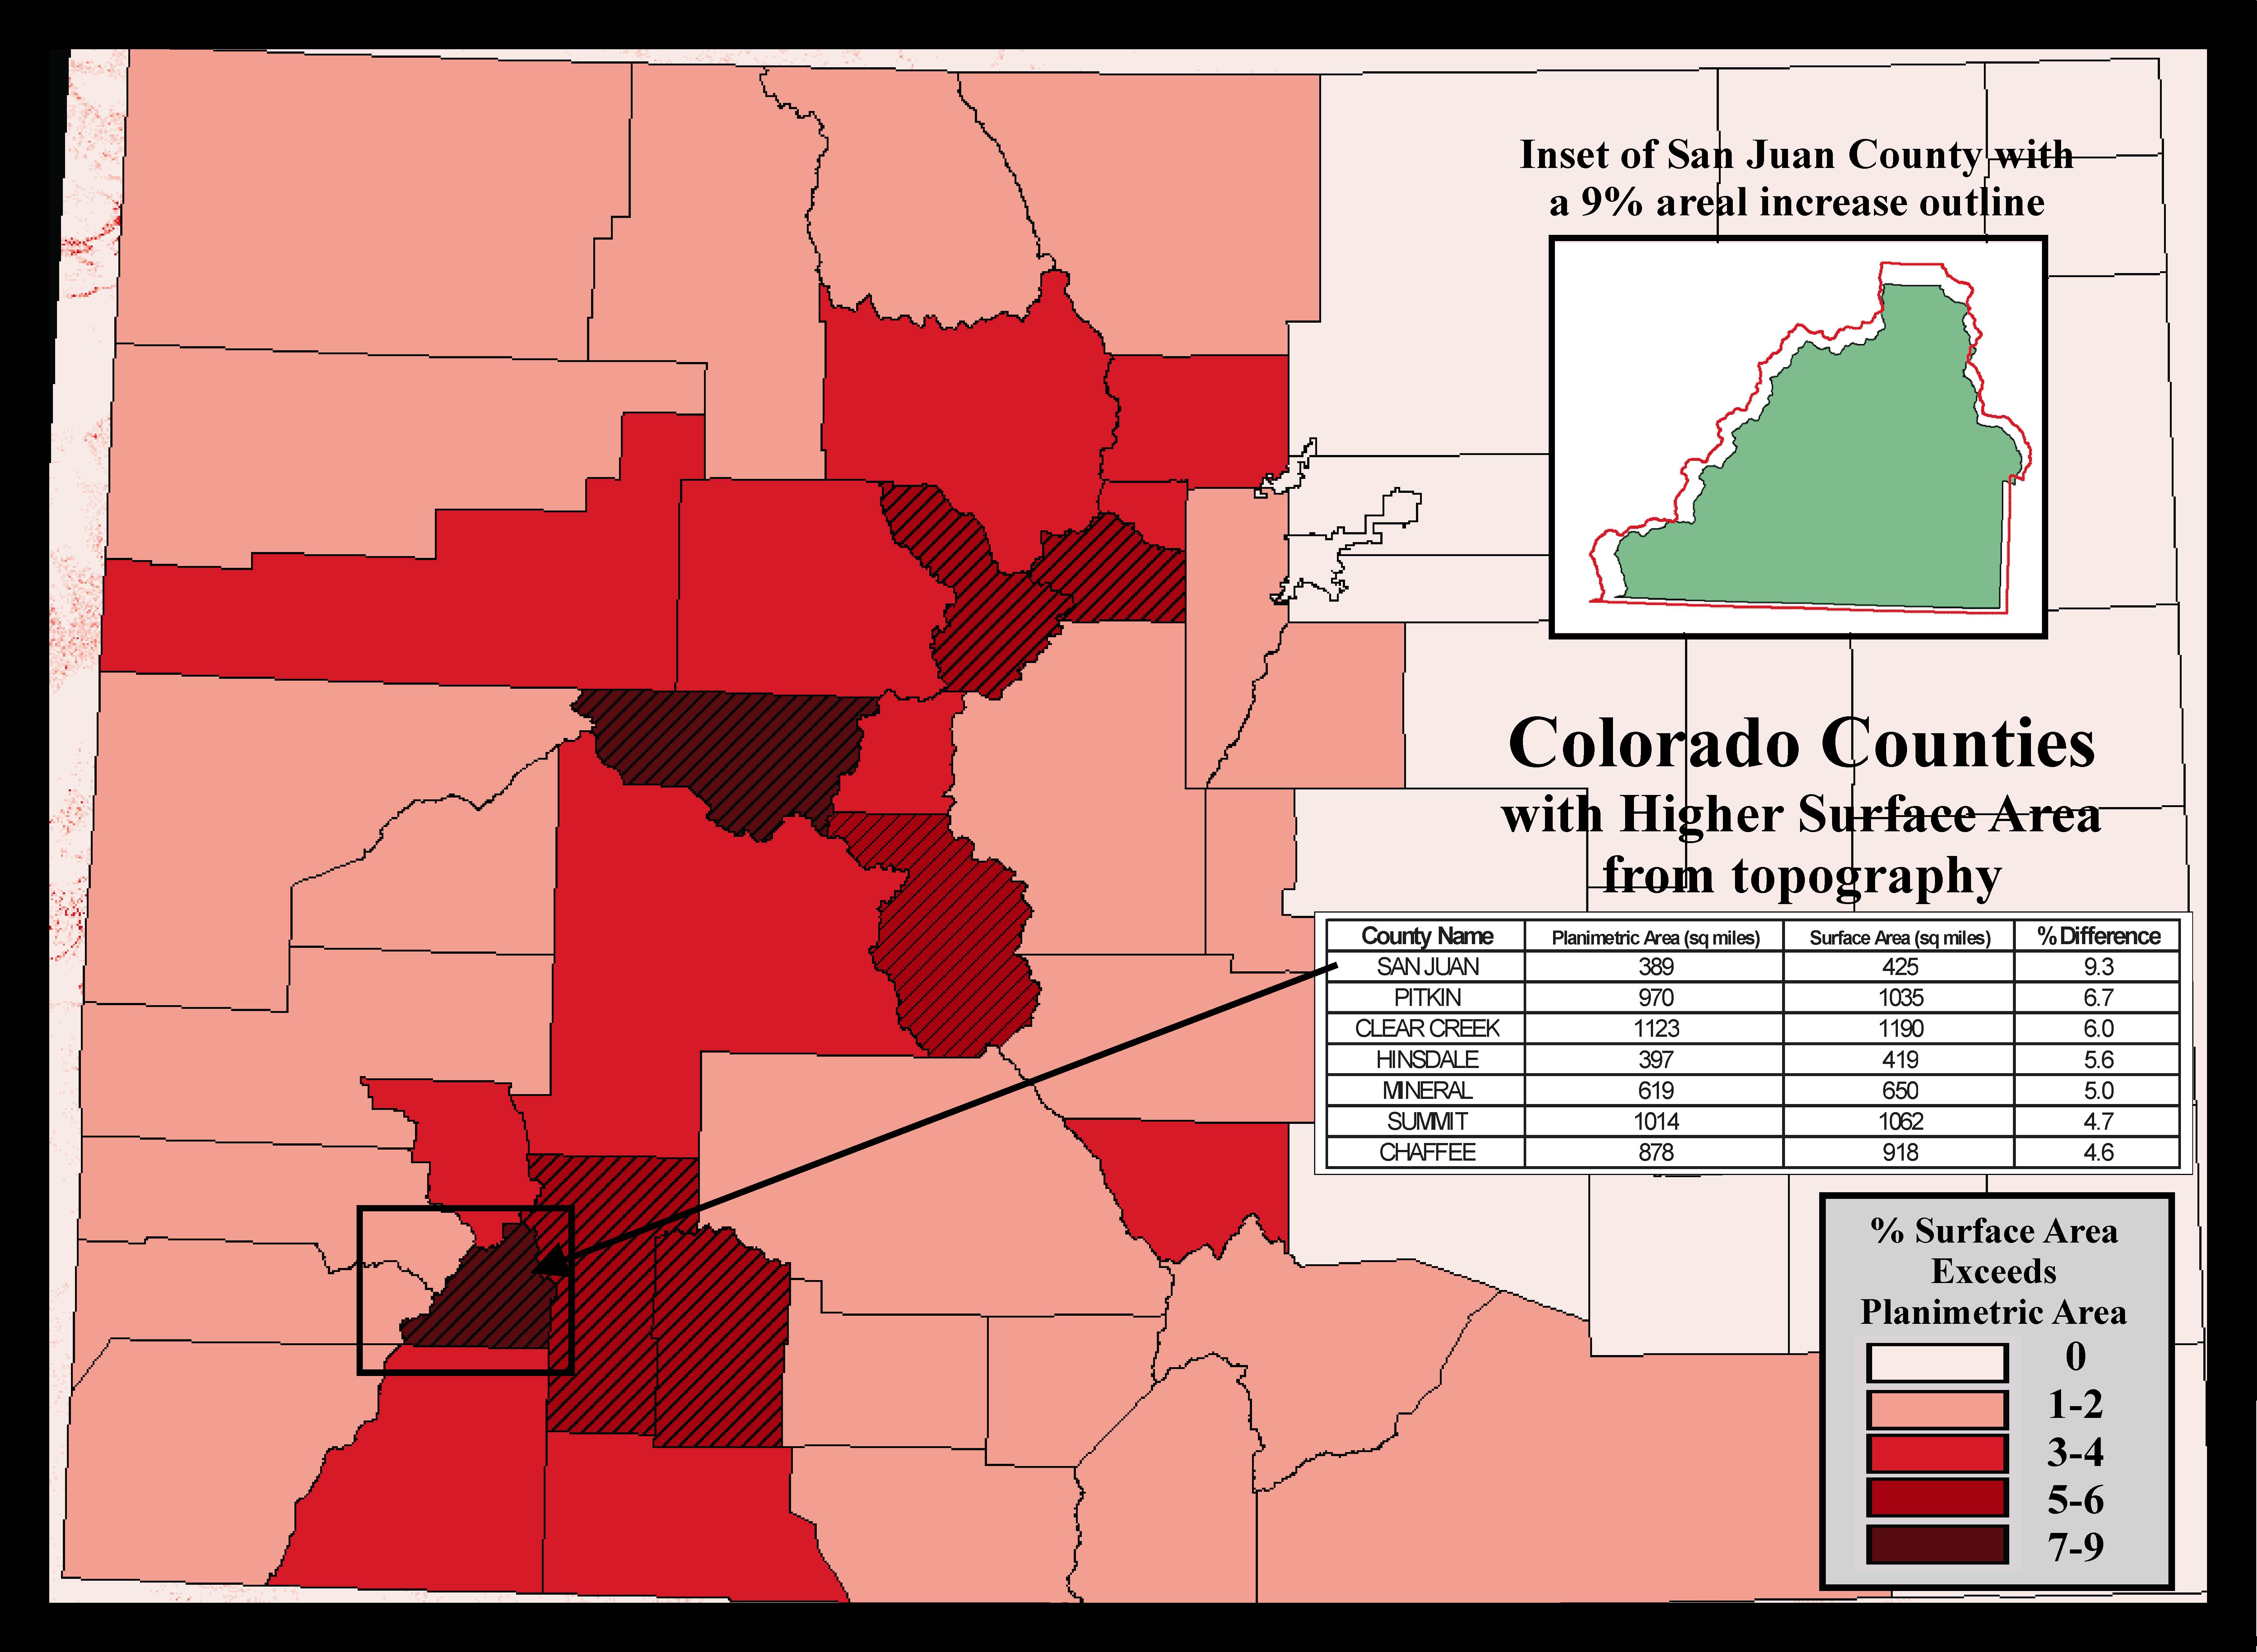
Figure 3 shows the results
with the light-toned eastern counties having zero percent change, medium-toned
from 1-4 percent change and the dark red-toned from 4.6 to 9.3
percent change. The seven darker
cross-hatched counties exhibit the greatest change from 4.6% through 9.3%.
The inset in top-left portion
of the figure compares the planimetric representation of
The ironing out of
The exercise, however, is a
good one for conceptualizing the differences between planimetric and surface
area representation. Come to think of
it, would the Canadian Rockies around
____________________________________________________
Note: The
referenced Beyond Mapping column is
posted online at
http://www.innovativegis.com/basis/MapAnalysis/Topic11/Topic11.htm,
select “Calculating Realistic Areas”
For background theory and equations on calculating surface area and surface length and inclination of a line, see…
http://www.innovativegis.com/basis/Supplements/BM_Dec_02/Surface_Area3.htm