New Features in Surfer 8. 3D Surface Maps Surfer 8 produces spectacular 3D rendered surface maps with complete control over lighting and shading, position, rotation and tilt angles. Overlay raster and vector base maps, contour maps, image maps, shaded relief maps, post maps and vector maps and specify the color modulation (surface and overlay blending).
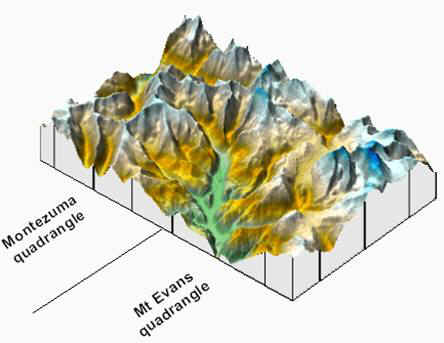
Drape a raster or vector base map on a 3D surface Grid Mosaic Combine adjacent and overlapping grid and DEM files into a single GRD to produce a single map. In areas of overlap, specify which grid nodes to use with the average, first, last, minimum, or maximum methods. Use the existing grid nodes, or resample at a different grid spacing using bilinear interpolation, cubic convolution, or nearest neighbor sampling methods.
This surface map was created with a grid resulting from the combination of the Montezuma and Mt Evans Colorado 7.5 minute DEM files. Vertical lines on the base represent offsets caused by difference between UTM coordinates and latitude / longitude definition of quadrangle boundary Cross Validation Select the Cross Validate option to compare the Z value of a data point with the results of gridding without that point. Write the results to a statistics report and to a data file.
Specify the number of points to validate, statistics report, and results data file name. Grid Filter The Grid Matrix Smoothing options have been expanded into the new Grid Filter featuring more than sixty predefined filters. In addition, define your own filter parameters to refine your grid.
Choose from a large selection of predefined grid filters, or define your own. Data Metrics Create grid files and maps illustrating spatial statistics within the search ellipse such as number of data points, approximate density, distance to nearest and farthest point, mean, standard deviation, variance, and coefficient of variation of the Z values.
Use the Data Metrics gridding method to grid and map spatial variation of statistical parameters. Improved User Interface Equals Increased Ease-of-Use
Speedier
Larger Worksheet Read data files with up to one billion (109) rows and columns, subject to available memory .
Rotate and Tilt Raster Maps View your bitmap images from the best angle. Rotate and 3D tilt shaded relief maps, image maps, and raster base maps.
USGS DRG base maps and other raster maps can be rotated and tilted to any angle. New Gridding Methods Surfer continues to dominate the field with the addition of new gridding methods. New methods include:
Other new gridding features include:
Export the triangulation
network to a raster or vector file, create a base map New Variogram Models Surfer 8 adds the Cubic and Pentaspherical models to the variogram analysis.
Additional variogram models
give you more choices when Support for More File Formats More import and export options have been added to the already long list of file formats.
Use USGS SDTS DEM and DLG Files in Native Format Use the new format USGS SDTS Digital Elevation Model files (DDF) in Surfer to make contour, surface, wireframe, vector, shaded relief, and image maps. Maximum Plot Size Increased The old 32-inch (81 cm) page limit under Windows 98 and Me has been banished. The default maximum page size is 110 inches (279 cm), with the option to increase the maximum size to 2000 inches (5080 cm). Download the Latest Version with Internet Update Check for the latest version of Surfer 8 using your Internet connection. If there is a newer version available, download and install it automatically. View the Version History for a list of changes in versions subsequent to 8.00.
Surfer 8 makes it easier than ever to stay up-to-date with the latest version of the software. Learn more about Golden
Software Products on this CD! Please visit the Golden Software web site
at While visiting the web site, you'll be
able to Copyright 2002, Golden Software, Inc. |