|
Topic 9 – Putting GIS in
the Hands of People |
Spatial Reasoning
book |
Put
Things in Their Proper Places with GPS — identifies
the basic concepts, principles and theoretical underpinnings of the Global
Positioning System (GPS)
GIS and Remote Sensing Share a
Lofty Marriage — identifies the basic concepts, principles and
theoretical underpinnings of Remote Sensing (RS) technology
Heads-Up and Feet-Down
Digitizing — discusses
the design components of a GIS/GPS/RS field unit
<Click here> for a printer-friendly version of this topic
(.pdf).
(Back to the Table of Contents)
______________________________
Put Things
in Their Proper Places with GPS
(GeoWorld, September 1995)
GIS is
awesome. It allows you to view maps in
the blink of an eye, visualize spatial patterns in datasets, and even model
complex relationships among mapped variables.
But its abstract renderings (i.e., maps) require a real-world expression
to make GIS a practical tool. For years,
"field folk" have been swatting mosquitoes and lusting for a simple
way to figure out where they are and where they're going. Celestial navigation methods used by early
mariners as they gazed at the heavens eventually gave way to surveying and
mapping sciences. But such solutions
still seem beyond the grasp of average bushwhackers. What's needed is a simple field unit that
puts the awesome power of GIS in their hands.
That's
where the Global Positioning System (GPS) comes in. Based on a constellation of 2l satellites,
each of which circles the globe every l2hours, GPS links GIS maps and their
datasets to real-world positions and movements.
In effect, a set of man-made stars supports the electronic equivalent of
celestial navigation. How does it
work? And will it work for you?
Figure
1 shows important GPS considerations.
The system employs the same principle of triangulation commonly used in
scout camp and high school geometry.
Circles of a calculated distance are drawn about a set of satellites
whose precise positions are known through orbit mathematics described in
satellite almanacs. The intersection of
the circles determines your position on Earth.
In trigonometric theory, only three channels (satellites) need to be
monitored, but in practice four or more are required to cancel receiver clock
errors. The radii of the circles are
determined by noting the time lag for a unique radio signal from a satellite to
reach you, then multiplying the elapsed time by the speed of light at which the
radio waves travel. The world of
electronic wizardry (involving technical stuff like pseudo-random code, carrier
phase, ephemeris adjustments, and time hacks) allows timing to one billionth of
a second (.0000000001), producing extremely accurate distance measurements in
three-dimensional space. Generally,
averaged stationary measurements (static mode) tend to be more accurate thanthose made while moving (kinematic mode).
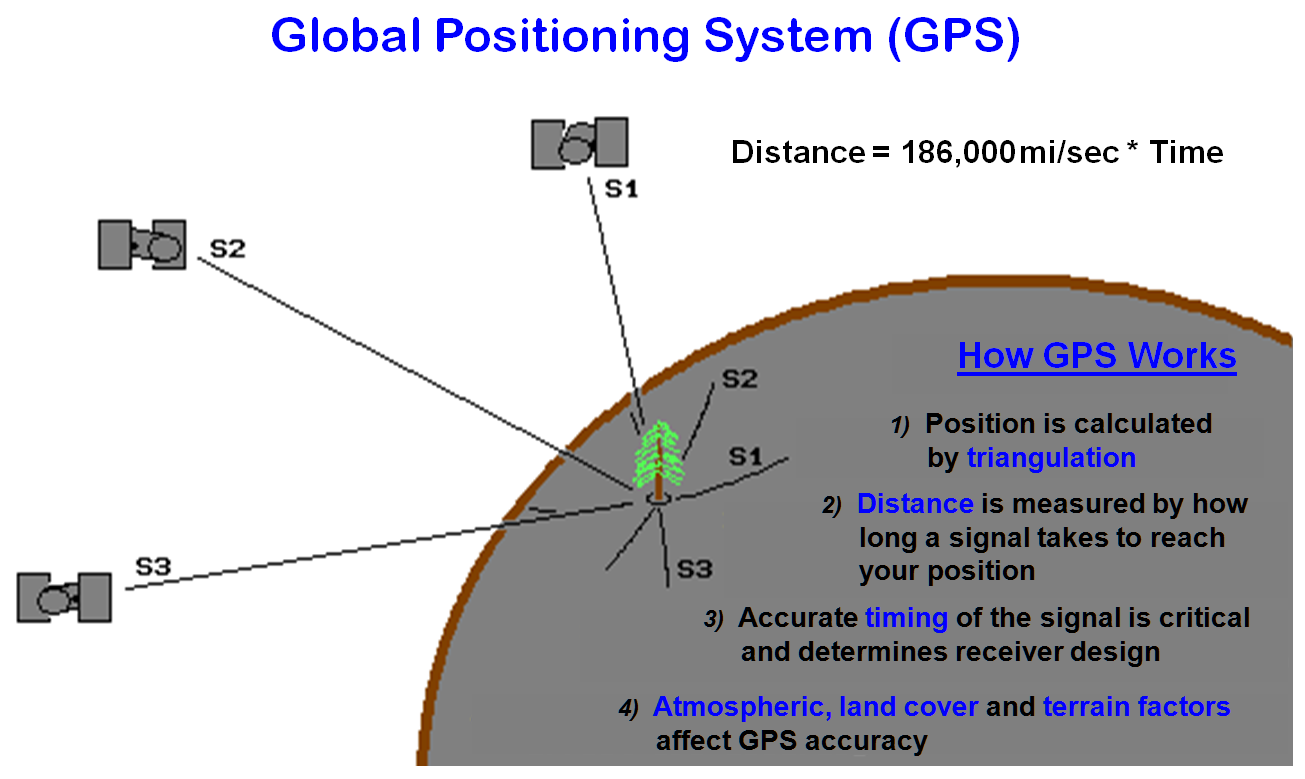
Figure
1. The basic elements and
considerations of the Global Positioning System.
As with
everything in the real world, actual GPS performance depends on several
muddling factors, the most influential of which is GPS's history as a U.S.
Department of Defense program. The
government financed the $10 billion system for military purposes and feels
uncomfortable if just anyone, such as terrorists or enemy troops, can simply
tap into the system. The government
purposely degrades the signal by using an operational mode, Selective
Availability (S/A), which provides only 100-meter accuracy. With S/A turned off, 30-meter accuracy is common.
The
degraded signal can be improved by a differential correction. A differential GPS uses a local reference
receiver whose exact position is known.
When the reference receiver gets a satellite signal, it calculates its
implied position, then quickly "reverse calculates" the error
correction needed to place it where it should be. The correction is broadcast to field units or
stored for post-processing back at the office.
In
general, there are two main hurdles in processing GPS signals: jitters and
jumps. As with any
instrument, inherent error for a set of readings at a fixed location yields a jittery cluster of possible positions,
termed the “sphere of uncertainty.”
Also, satellites come and go with time; as one is dropped and another
picked up, the positions often take a temporary
jump. Processing software uses
running and dampened averages of several readings to cope with jitters and
jumps. Keep in mind that the silicon in all GPS receivers is about the same—
creative software separates one receiver from another.
A
well-tuned differential GPS system in static mode can place you within a meter
horizontally and five meters vertically, while a simple autonomous system for $200
or so can place you somewhere within a ball park-that is if atmospheric, ground
cover and terrain factors permit— signals deteriorate under dense forest canopy
or at the bottom of steep canyons. Also,
the satellites aren't always available in a nicely dispersed pattern. That means you need to plan to be in the
field at the times the satellites' celestial charts dictate. (Try explaining
that one to your field crew.) Finally,
it's important to keep in mind that GPS isn't intended to fully replace conventional
surveys. Rather, it augments cadastral
records with real-time and real-world positioning.
GPS's
ability to locate positions on Earth's surface rapidly and accurately is a
powerful addition to GIS. For example,
the boundary of a wildfire can be digitized quickly with a GPS simply by
walking (or flying in a helicopter) over the burn's perimeter— putting the fire
in the GIS while it's still hot. From a
forester's perspective, the GPS’ed map can be
overlaid on existing inventory information to quantify timber lost and plan for
salvage logging and forest regeneration.
From a wildlife biologist's perspective, the burned area can be
translated into habitat loss estimates, affected animal populations and ecosystem
recovery plans. That means the forester,
biologist, and others can be locked in honest debate regarding accurate and
fully integrated data within hours of a geographic event.
In
addition, a GPS receiver can be attached to a vehicle to generate an accurate
map of important features and roads en route to various locations. According to rangers working in the U.S.
Forest Service’s Rocky Mountain region, GPS has reduced the time they spend in
the field 50 to 80 percent, with minimal crew instruction. For example, a two-man team using GPS completed
a section subdivision in less than a day— a task that normally takes a week
with conventional survey techniques.
GPS's
contribution to generating and updating GIS maps is obvious. Yet GPS is more than a data collection
device— it's a practical tool to navigate GIS results. As GIS matures, more of its applications will
involve GIS modeling, such as variable-width buffers around streams that allow
for terrain steepness, ground cover, and soil erodibility. Although such relationships follow common
sense, their spatial expression is complex.
The contractions and expansions of a variable-width buffer on a paper
map are practically gibberish to a field crew' If the coordinates of the buffer
are loaded into a GPS, however, the result delineates the spatial reasoning and
its complicated expression in the actual landscape.
GIS and Remote Sensing Share a Lofty Marriage
(GeoWorld, October 1995)
As noted
in the previous section, GIS/GPS technology positions spatial data and
reasoning on the landscape. But
effectively identifying, measuring, and monitoring the landscape over extensive
areas is an ongoing challenge. Remote
sensing (RS), closely related to GIS, greatly enhances the technical mapping
toolkit. Remote sensing is GIS's older
brother, using relative variations in electromagnetic radiation (EMR) to
identify landscape characteristics and conditions. In fact, so do your eyes. Sunlight, the form of EMR we see, starts off
with fairly equal parts of blue, green, and red light. When sunlight is reflected from a leaf, the
red and blue right is absorbed in photosynthesis and your eyes detect mostly
the unused green light. Your brain
interprets the subtle differences in the amount of blue, green, and red light
to recognize the thousands of colors we relate to our surroundings.
A
remote sensing satellite operates similarly.
Its instruments focus for an instant at a spot on the ground measuring less
than a quarter acre (see figure 1). Like
your eyes, it records the relative amounts of the different types of light it
"sees"— a lot of green for a dense, healthy forest; less green and
more blue and red for bare ground. In
addition to normal light (the visible spectrum), it can record other types of
EMR our eyes can’t see, such as near infrared, thermal, and radar energy. As the sensor sweeps from side to side and
the satellite moves forward, it records the light from millions of spots,
termed pixels for "picture elements."
When the pixels are displayed on a computer, they form an image similar
to an aerial photograph. Yet keep in
mind that behind the image are millions of numbers that record the relative
amounts of energy returned for various types of light at each spot.
That organized
mountain of numbers is used to identify land-cover characteristics and their
condition. First, the computer is
"trained" by locating representative areas of the cover types to be
classified— sort of rubbing the computer's nose in what it should know. Then that information is used to classify
other areas with similar EMR responses.
As shown in the center of figure 2, the computer examines the amount of
light for each type from the hundreds of training pixels in the examples. It notes that forests tend to have high green
and low red responses, while bare ground has low green and slightly more
red. The big dot in the center of each
data cluster is the average amount of green and red light the typical response
for that cover type.
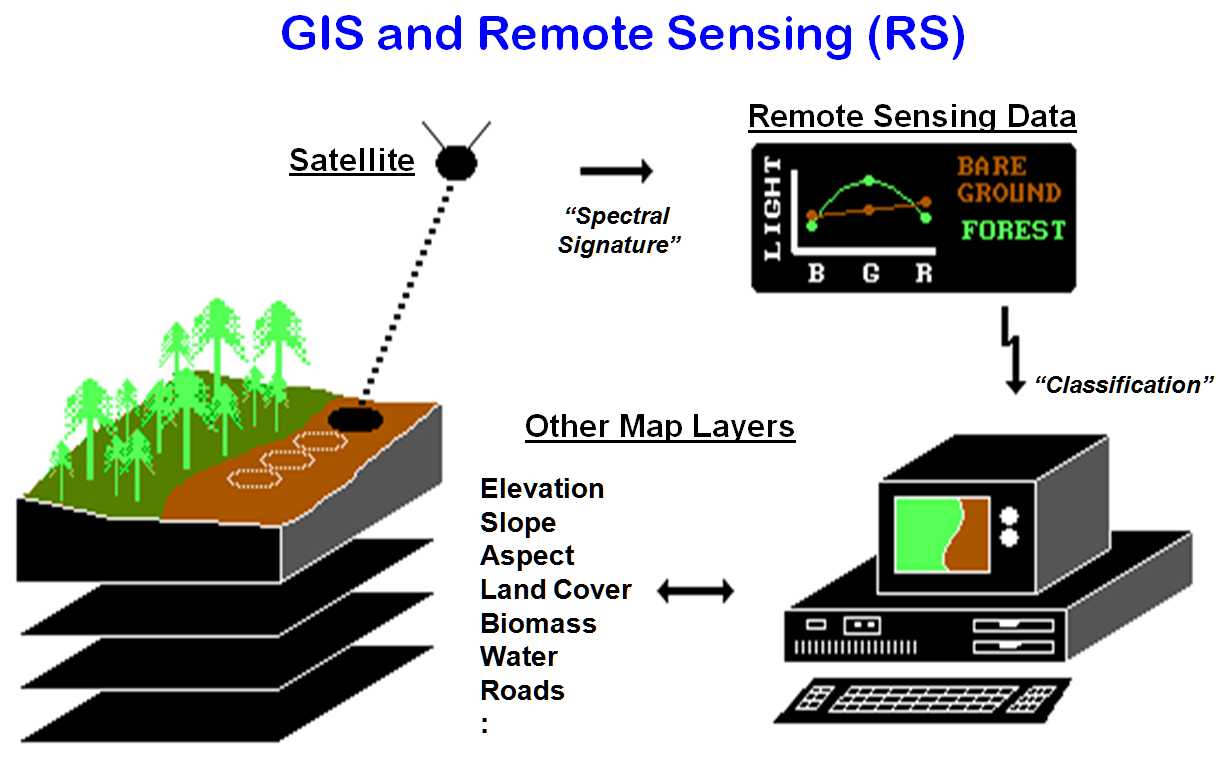
Figure
1. Remote
sensing's basic elements and considerations.
Now the
computer can consider the green/red responses for the millions of other
locations and classify them through "guilt by association" with the
training set statistics. In effect,
through complex computer mathematics it plots an unknown location's green/red
numbers (the "x" in the right graph of figure 2) notes the distance
to the typical responses, then classifies the location as the closest cover
type. Then it moves to the next spot,
and the next …until the entire area has been classified. You could do that, but your patience would
ebb at about the second location for a set of several million in a typical
satellite image.
Just as
you use more than color to identify a tree, so can the computer. That's where GIS lends remote sensing a
hand. The GIS uses the example locations
to check its database to see if there are other typical conditions for a cover
type. For example, if two forest types
have similar EMR responses, the knowledge that the unknown location is “a
steep, northerly slope at high elevation" might be enough to tip the
scales toward a correct classification between the two.
In
return for its help, the GIS gets a copy of the
classification results-a completed cover map.
By comparing the maps from two different times, the computer can quickly
detect and quantify any land cover changes.
In the GIS, data on wildlife activity can be summarized for each cover
type to see which is preferred. Once a
preference is established, the loss (or gain) in an animal's preferred habitat
can be inferred, measured, and plotted at megahertz speed. Keep in mind that remote sensing and GIS
provide educated guesses at actual characteristics, conditions, and
relationships. They aren't perfect, but
they provide powerful and compelling insights.
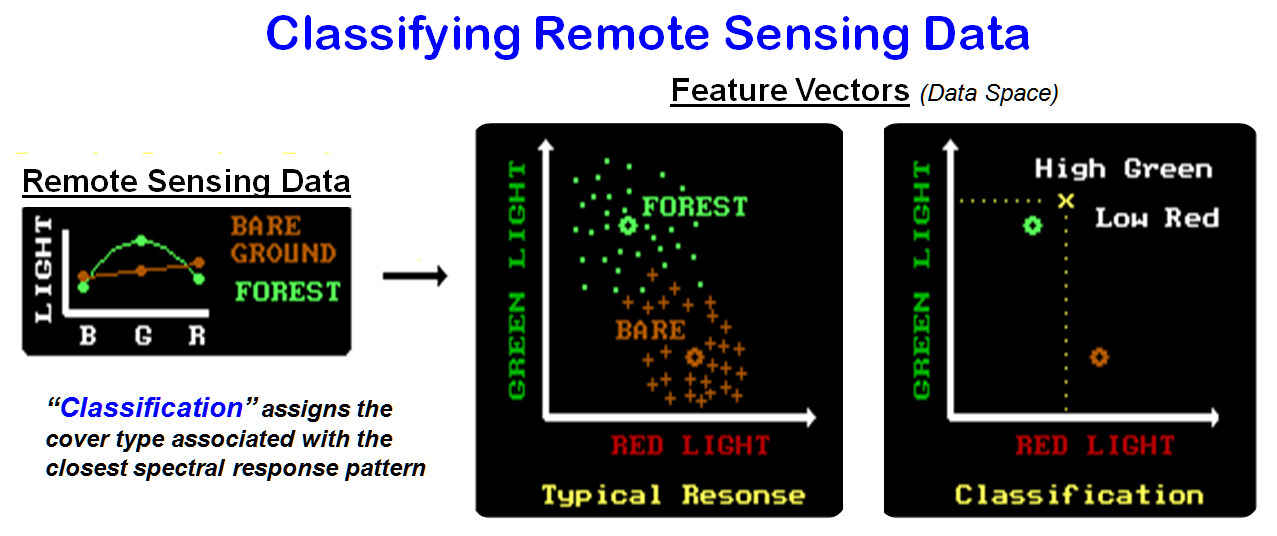
Figure
2. Classifying remote sensing data based on
spectral response.
In
fact, remote sensing provides an element that's unavailable with traditional
mapping: uncertainty assessment. At the
moment of classification, the computer knows which typical response is closest
and how close it is. If it's very close,
then you're fairly confident of the classification. As it gets farther away, you're less
confident. Relating the closest distance
to those of other possible cover types yields even more information— sort of a
probability sandwich of a location's cover type. The next closest typical response identifies
a second guess at classification, and how much farther away it is indicates the
degree of confusion between the two possibilities.
If an
unknown location sits halfway between the typical responses of two cover types,
it's a toss-up. As an unknown's response
moves closer to a typical response, classification certainty increases-maybe,
maybe not. That's where things can get a
bit confusing. Note the data patterns
(dots for forest and crosses for bare ground) in the typical response plot in
figure 2. The forest responses in its
training set is fairly compact and circular, while the bare responses are more
dispersed and elongated in the direction of the typical forest response.
The
shape of the data cluster, as well as its positioning, provides even more
information about classification accuracy.
The more dispersed the pattern is, the less typical the typical response
is. If the data have a trend
(elongated), it means the data are more apt to be confused with other cover
types in that direction. All this
statistical stuff is contained in the training set's joint mean and covariance
matrix— take my word for it, or go back for an
advanced degree in multivariate statistics.
The upshot is that remote sensing classification tells you what it
thinks is at a location and honestly reports how well it's guessing. This shadow map of certainty is the
cornerstone of thematic error propagation (see BM II Topic 4 for a related
discussion). Without it GIS models just
flap in the wind.
Heads-Up and Feet-Down Digitizing
(GeoWorld, November 1995)
The
previous two sections described the GIS/GPS/RS mapping triad. GIS expresses relationships among maps; GPS
links map coordinates to real-world locations; and remote sensing directly
records and classifies current views of the landscape. For years, GIS and remote sensing have been the realm of specialists in segregated offices
"down the hall and to the right."
In part, the division between mapped data providers and users was
technological. GIS and remote sensing are
inherently complicated fields, with more than a smattering of statistics,
mathematics, and computer science. Also,
their data loading and processing demands required expensive, specialized
equipment.
More
recently, low-end computers have grown up with storage, processing, and display
capabilities approaching those of expensive workstations sold just a couple of
years ago. Concurrently, the user
community is becoming more computer literate, at least in PC-based
applications. Moreover, more users recognize
the importance of spatial attributes in datasets. With all of these trends in place, why isn’t
integrated GIS/GPS/RS in the hands of more people?
Part of
the answer lies in cultural lags for providers and users. The providers are close to the complexities
of spatial data and their analysis. As a
result, the providers focus on a capabilities "toolbox" that can do
anything. The users, however, know
exactly what they want the toolbox to do-usually automating current tasks. Anything more is simply confusing and
esoteric theory. Both groups reflect
their professional cultures and somewhat divergent views of the environments
and the applications of spatial technology.
Another
part of the answer lies in the delivery of spatial technology. By their nature, maps are abstract renderings
of real-world objects. In its least
abstract form, spatial processing mimics cartographic concepts that aren't well
understood by most potential users. As a
result, such users have an uneasy feeling about maps— particularly if they're
on a computer. So what's needed to melt
these spatial cold pricklies into warm fuzzies?
A fully
integrated GIS/GPS/remote sensing field unit would help. For example, figure 1 shows an aerial photo
(remote sensing) as a backdrop registered to a road map (GIS). The large star near the center of the figure
identifies the GPS unit's current position.
Now a skeptical user sees the road behind him and the clump of trees to
the left. The integrated presentation
takes the abstraction out of mapping and inserts human experience.
Important
features can be encoded by tracing them on the screen with the aerial photo as
a guide (termed “heads-up” digitizing, because your head is tilted up toward
the screen). Or, as in this case, “feet-down”
digitizing can be done by walking the perimeter of a field of interest to
generate a GPS track log as you go. The
proverbial "farmers from Missouri" can actually experience the link
between a map and the real world.
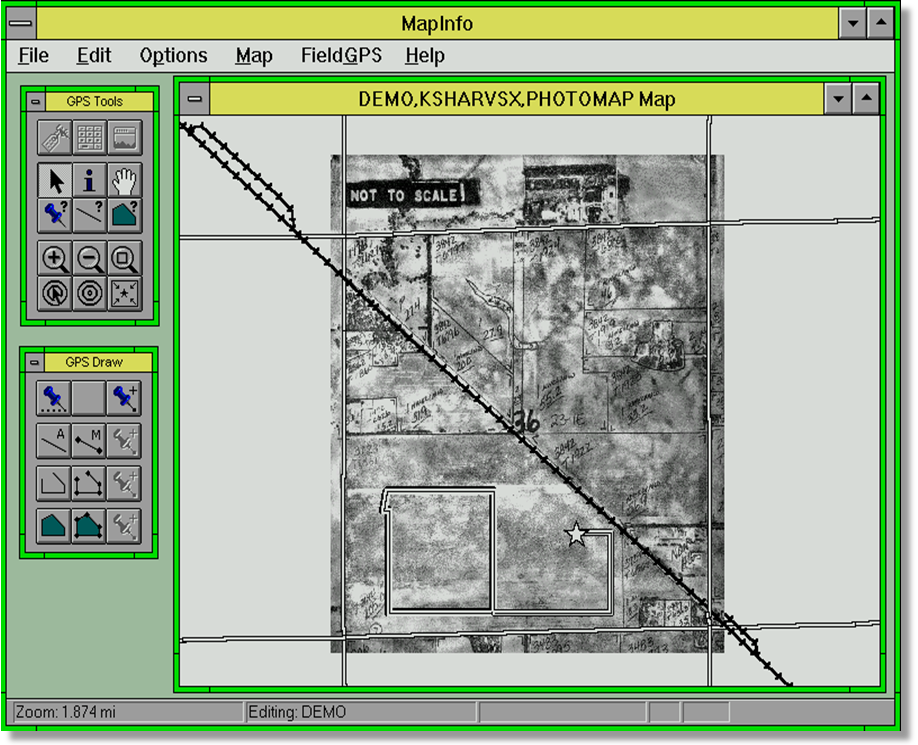
Figure
1. A Gls/GPS/remote sensing integrated display. Plot generated
using MaplnfoTM (Maplnfo Corporation) and FarmGPSTM
(Farmer's Software, Incorporated).
In
fact, a field GIS/GPS/remote sensing unit forms the foundation of precision
farming, an emerging technology that places the unit in a tractor's cab and
position stamps its location as it moves through a field. In a harvester, the unit can monitor crop
yield and moisture content and relate measurement variances to soil maps and
other terrain factors. On a spray rig,
the unit can vary the application of chemicals as the tractor moves across a
field. In crop research, the dataset
represents a complete census of field inputs and outputs-a giant step beyond a
few similar research plots at the university 70 miles away. Imagine the impact on any of the spatially
oriented sciences and their management expressions.
So what
comprises a GIS/GPS/remote sensing field unit?
Chances are you'll need more than simple coasters attached to your GIS
workstation and a long electrical cord.
When "blue-skying" the possibilities
with clients, I begin with four initial considerations: applications, operating
environments, data loadings, and processing requirements. A clear, concise statement of what the device
must do sets the stage for how it will be used and what capabilities are
needed. For example, precision farming's
application involves a mounted unit focused on precise kinematic GPS with
extensive data loadings and on-board processing demands. A hand-held unit for timber inventory,
however, focuses on a small set of field measurements, requiring minimal data
storage and post-processing. But it all
has to fit into a small, rugged shell.
Such
considerations establish the scope of the application and its baseline
requirements. The next step translates
the requirements into the following design components:
-
integrated software— GIS, GPS, remote
sensing, statistics, office ...
-
processor— '486, Pentium ...
-
operating system/environment— UNIX, DOS,
Windows, Next ...
-
memory— RAM, EPROM, flash cards, disk,
tape ...
-
ports/slots— RS232, LTP, PMCIA, SCSI ...
-
screen— active/passive, reflective/transflective/backlighted ...
-
input device— keyboard, pen, touch,
voice ...
-
peripherals— printer, plotter, sound,
video, digital camera ...
-
power— external/internal, protection,
battery life, recharge rate ...
-
durability— dust, splash, water,
temperature, shock, electromagnetic fields resistant ...
-
physical—
mounted/portable, size, weight, construction...
Whew! That's a lot of techy stuff better left to
the engineers (and there's a bunch of these new-wave GIS’ers hard at
work). The trend toward a GIS/GPS/remote
sensing field unit promises to revolutionize current spatial technologies. No longer can the spatial triad operate
independently. No longer can a one-size
solution fit all applications. GIS's
comprehensive toolbox needs to be open to other systems, reducible to the
subset of directly needed functions and designed for small boxes— in short,
tailored to individual end-user applications.
GIS can't stop with the colorful plot of a map generated in the GIS
office down the hall and to the right; it needs to be extended into the field
and placed in the hands of people to support the spatial decisions they make
and implement.
_____________________
(Back
to the Table of Contents)