|
Topic 1 –
Understanding GIS |
Spatial Reasoning
book |

Distinguishing
Data from Information and Understanding — considers the fundamental
concepts behind moving mapped data to information and ultimately to
understanding
Moving
Toward a Humane GIS — describes
an interactive link between GIS model logic and code
Consider
a GIS Modeler’s Toolkit — discusses an Object-Oriented Programming System
approach to GIS model development
<Click here> for a printer-friendly version of this topic
(.pdf).
(Back to the Table of Contents)
______________________________
Distinguishing Data from Information and Understanding
(GeoWorld, October 1993)
The digital map is at the
core of GIS. From that perspective, a
map isn’t simply a comfortable, colorful image, but an organized set of
numbers. Analyzing these data involves processing
thousands upon thousands of numbers to produce a set of new numbers (i.e., a
new map). That is a tedious task for
humans so we rely on our sickly gray, silicon friends. It isn’t that we couldn’t do what computers
do; it’s just that we have more creative things to do. We are creative (fire) while our computers
are computational (ice).
As with any new technology,
GIS’s sharp contrast acts like a Rorschach inkblot test—in one instance it appears to be one thing (image); in the
next it’s another (numbers). What is
needed is a blending of the two perspectives into a middle ground of creative
computation. So what’s holding us
back? Two things come to mind— 1) the
complex nature of spatial problems and 2) the inhumane nature of GIS.
Let’s consider the complex nature of spatial
problems. Historically, mapping was
simply a matter of not getting lost and maps were used to identify the
placement of features on pocket-sized abstractions of our landscapes and
seascapes. Then maps evolved into
graphical inventories “linking features” to attributes describing the
character, content and condition of mapped entities. Now we are enamored with the potential of a
GIS to address complex spatial problems using “map-ematical
modeling.” From determining the optimal
route for a proposed highway to identifying the ideal habitat for spotted owls,
GIS is viewed as a decision-makers salvation.
But is it really?
It’s generally accepted
that good data are the prerequisite of good decisions. With the advent of the computer, good data
often are equated to voluminous data—the more the better. In reality, mounds of data must be sieved for
a subset that’s significant and relevant to the decision at hand. The true effectiveness of any information
system lies in its ability to distill data
(all facts) into information (useful
facts). GIS is adept at swallowing
tremendous amounts of spatial data, then repackaging and presenting germane
information to the user.
Yet descriptive information
isn’t enough in many decisions. Consider
figure 1 which is based on sociology’s enduring quandary of fact/value
conflicts. The lower-right panel of the
matrix identifies the ideal condition (COMPUTATIONAL) in which there is social
agreement on the facts and values surrounding a decision. That is computer heaven in which efforts are
focused on perfecting the computational solution. In that role, GIS is viewed as a Decision
Making System (DMS) which is coupled tightly to mathematical models. Under these conditions, science and
technology are indisputably paramount, with their solutions directly
translating into decisions.
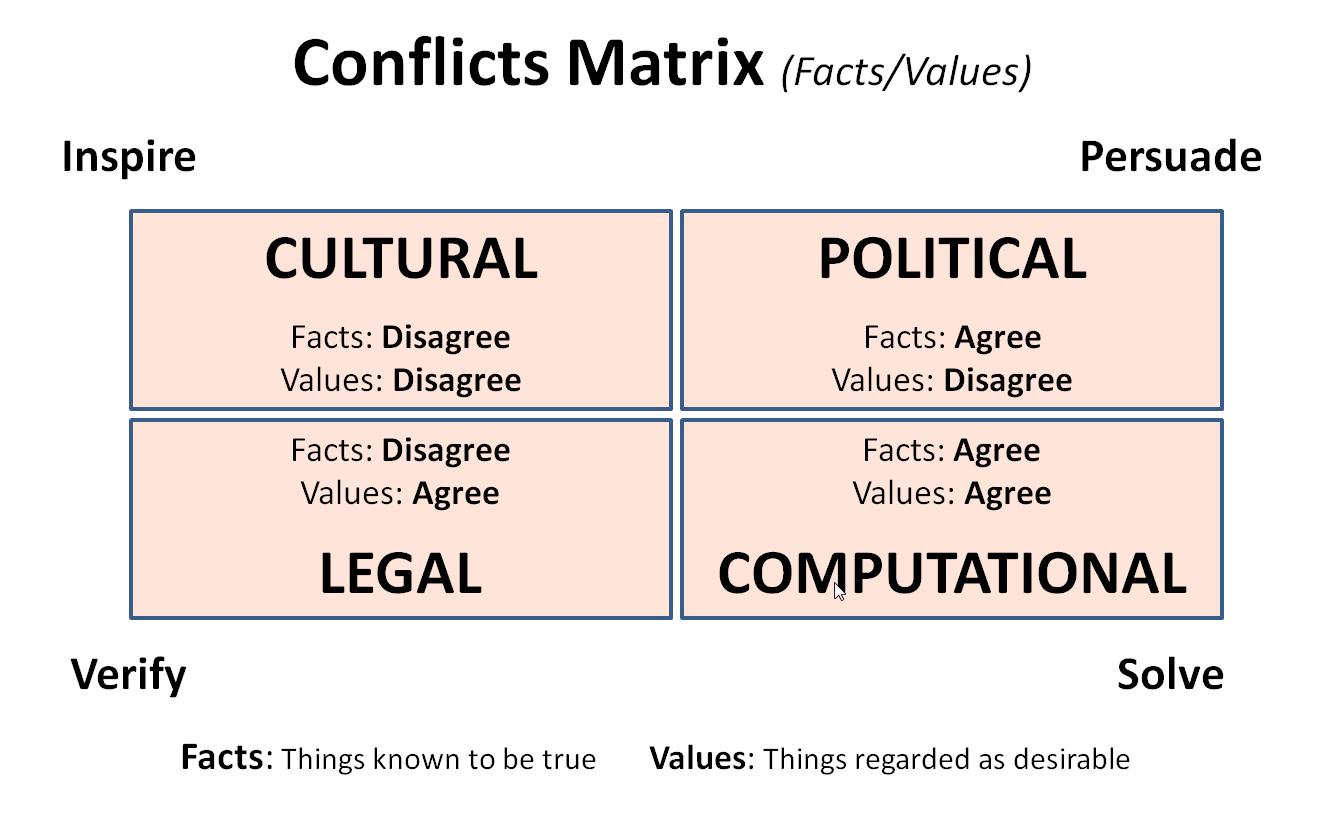
Figure 1. Only a subset of all land use issues involves
computational solutions. Most use the
computer as a vehicle for communicating various perspectives of an issue
through spatial reasoning and dialog.
However, many of the
decisions facing GIS fall outside the COMPUTATIONAL panel. Consider the LEGAL panel in the lower-left in
which there is agreement on values but disagreement on facts. It’s like the accused of a heinous murder
claiming he was at home in bed at the time, while the prosecutor claims he was
at the scene of the crime. In that role,
technology is called on to “verify” the facts by viewing and comparing
alternative definitions of fact. In
techy-speak , that means “establishing the sidebars of
the system’s response.”
A POLITICAL conflict
(upper-right panel) is the opposite. In
that decision environment there is agreement on facts, but disagreement on
values. For example, we might agree on
the fact that a species is endangered but disagree on the relative value we
place on environmental and economic considerations. In that role, technology is used to persuade
society (or at least a majority) of the logical reasoning supporting a
position. The CULTURAL panel
(upper-left) is the murkiest of all—disagreement on facts and values (e.g., the
abortion issue). Under these conditions
technology is ineffective, with their solutions having little relevance to
either the discussion or a decision.
But what does all this
esoteric stuff have to do with a GIS?
It’s just a data sponge that draws awesome graphics, right? Actually it is a Decision Support System
(DSM) that transforms data into information.
And if used creatively, it can transform information into understanding of the complex nature of
spatial problems, which in turn, can lead to viable decisions. It’s preposterous to assume that one more
decimal place of accuracy in a spatial model could solve a complex problem in
which the facts and/or values are in dispute.
The computational approach only works on a limited set of spatial
problems.
A view of GIS beyond data
and information is in order—one as a communication tool as much as much as it
is a mapping tool. A decision maker’s
understanding is as important to a good decision as good data. To paraphrase Professor Robert Woolsey at the
Colorado School of Mines, “Managers would rather live with a problem they can’t
solve than apply a solution they don’t understand.” As problems become increasingly gray, the
black-and-white approach of computational solutions becomes increasingly
limited.
The next section investigates
how GIS and creative computing can be used to extend data to information and,
ultimately, to understanding complex spatial problems. What do you say—a pipe dream or reality?
_____________________
Moving Toward a Humane GIS
(GeoWorld, November 1993)
The
previous section noted two things holding back GIS: (1) the complex nature of
spatial problems and (2) the inhumane nature of GIS. Many applications go
beyond repackaging mapped data into spatial information that is presented to
decision makers. Map-ematical
models relate spatial variables and, in some instances, can be used to
"solve" land use issues.
However, more often than not, a computational solution isn't possible because
complex issues often are driven by conflicts in facts and values among
individuals. In these cases words like
"verify," "persuade," and "inspire" replace
"solve." What is needed in
these situations is a decision-making environment that promotes enlightened
communication of the impacts of varying fact/value perceptions.
Or,
what is needed is a kinder, gentler GIS— one that fully engages decision makers
in the spatial analysis process, encourages them to try different
interpretations of a spatial model and compare the outcomes, and sanctions
spatial reasoning and dialogue. We have
the computer, the database, the analytical operations, and even a colorful set
of point-and-click icons. But we are
missing a succinct expression of a model's logic and an interactive mechanism
to execute the model under various interpretations.
Yet
don't despair. Your vendor's GIS
(Guaranteed Income stream) is addressing the situation
with a humane interface. Consider figure
1, a simple model to determine areas suitable for development as being gently
sloped and near roads. The upper portion
of the figure is a flowchart that graphically summarizes the model's logic as a
series of boxes (maps) and lines (operations).
Derived maps of slope and proximity to roads are created from the base
maps of Elevation and Roads, respectively.
The derived maps are "calibrated" in relative terms of
suitability, and then combined for an overall suitability map. The lineage, or pedigree, of the final map is
succinctly expressed in the graphic.
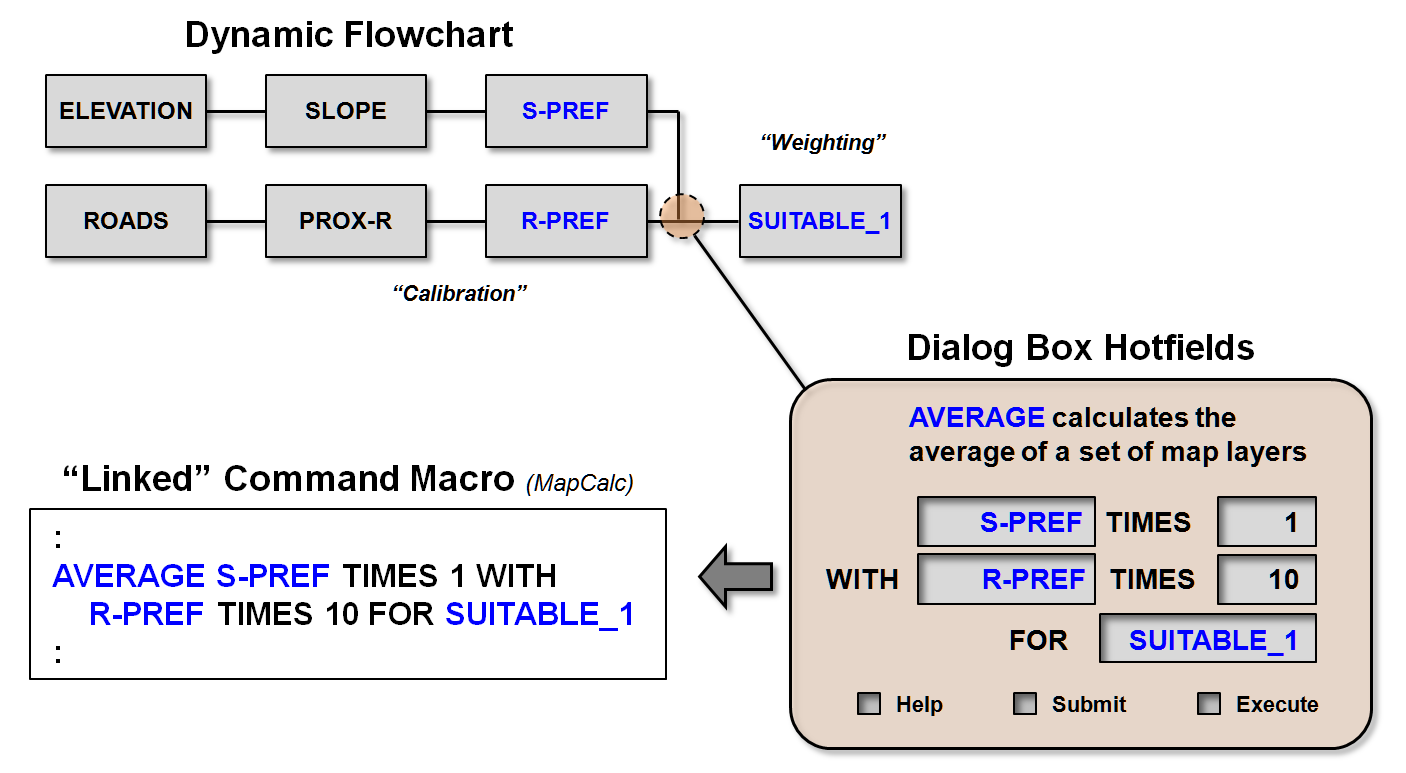
Figure
1. Clicking on a line (operation) in the dynamic
flowchart pops-up a dialog box with “hotfields” that allow users to
automatically edit and execute the linked command macro.
In a
humane GIS interface, the flowchart is linked dynamically to the database and
the command macro of the model. If you
click on a box, descriptive statistics and/or an image of the map pops up. A click on a line pops up a description of
the operation and its "parameterization" (lower right portion of the
figure). By clicking around the
flowchart, you can get a fairly good handle on the logic of the model-sort of a
personalized tour of the black box. That
exploratory interaction with the model develops an understanding of the spatial
reasoning supporting the application.
Questions, inconsistencies and gaps in logic are discussed with the
model developer. That dialogue can
enhance the decision maker's confidence in the model and refine the model as
well.
If the
user is authorized, another level of interaction can take place. When an operation's dialog box appears by
clicking on a line, its specifications are contained in hotfields. For example, if the weighting step is clicked as shown in the figure, the average dialog box pops up and the
current weights for the slope (S-PREF) and road proximity (R-PREF) preferences
are depicted. Clicking on the Help box
provides a more detailed description of the operation and its options. Armed with this knowledge, you can change the
weights so the average is more heavily influenced by the preference to be near
roads (one to 10 times the influence, as shown). To keep things straight, edit the final map
name to SUITABLE_1, as shown.
When
you finish editing the hotfields and submit the dialog box, the GIS code
associated with that step is edited automatically (lower left portion of the figure). You can pop-up and edit another step in the
model if you choose. When you click on
the Execute box, your revised command macro is run and the new to SUITABLE_1
map is generated. The revised flowchart
and macro form the pedigree of the new map, which in turn can be interactively
explored and revised. Each time a new
scenario is tried, the graphic and coded pedigree serves as the conceptual
audit associated with the alternative— an objective record of its fact/value
interpretations. Now we're talking.
Comparing
the results of your tinkering (successive SUITABLE_xxx
maps) provides insight into the model's sensitivity and plenty of material for
discussion. "Huh, you mean when
road proximity is considered 10 times more important, it doesn't change
suitability much? And that limited
change is concentrated in the southwest portion of the project area? Heck, it doesn't affect my property. I thought it would affect every square
inch." That direct interaction
fully engages stakeholders and decision makers in the analytical process. As they see the effects of their "what
if" questions, they develop a better understanding of the issue and its
ramifications.
"Naïve
you say. Pollyannaish. Detached ramblings of a
demented soul who never has been in the decision-making trenches. It never will work." These may be a few of the thoughts that cross
your mind. Yet consider the alternative:
a detached GIS producing an increasing deluge of colorful, yet indecipherable,
mapped gibberish. The humane GIS modeling
structure provides a user-friendly means for interacting with the GIS that goes
beyond map viewing. So what's in it for
the GIS specialist? That's for the next
section to tackle.
_____________________
Consider a GIS Modeler’s Toolkit
(GeoWorld, December 1993)
So what
does the future have in store for the GIS specialist's bag of tricks? The previous section proposed a graphical entry
mechanism into GIS application models for users, based on a dynamic flowchart
of the final map's pedigree. Such a
system allows decision makers to interactively tinker with a model and gain
valuable insight into its application-sort of a point-and-click tour of the
black box's logical reasoning. If the
user is authorized, that tinkering can expand to modifying the weights and
calibrations (model parameterization) to generate maps of alternative
scenarios. How the final map changes
under different interpretations becomes the real spatial information for
decision making. The maps themselves are
colorful products, but how they change leads to colorful dialogue.
OK, but
what does all that have to do with GIS modelers? The techy crowd merely codes, right? Yes, but the link between the command macro
and the dynamic flowchart is essential.
So why not have the modeler work with the same graphical interface to
build the model? Yep, that's it— a
graphical, object-oriented, GIS modeler's toolkit. At that level, construction and model
structure editing is provided for the modeler, as well as the simple viewing
and parameter editing granted to the users.
To get
a feel for how it might work, consider figure 1. Keep in mind that this approach is somewhere
between "scareware" and
"vaporware," but it's a probable future for GIS. The top portion contains a set of processing
widgets that are tied to data and operations.
The lower portion is a graphical workspace. A model developer uses the widgets to construct
a flowchart of an application. As the
flowchart is completed, the dynamically linked command macro is written
automatically.
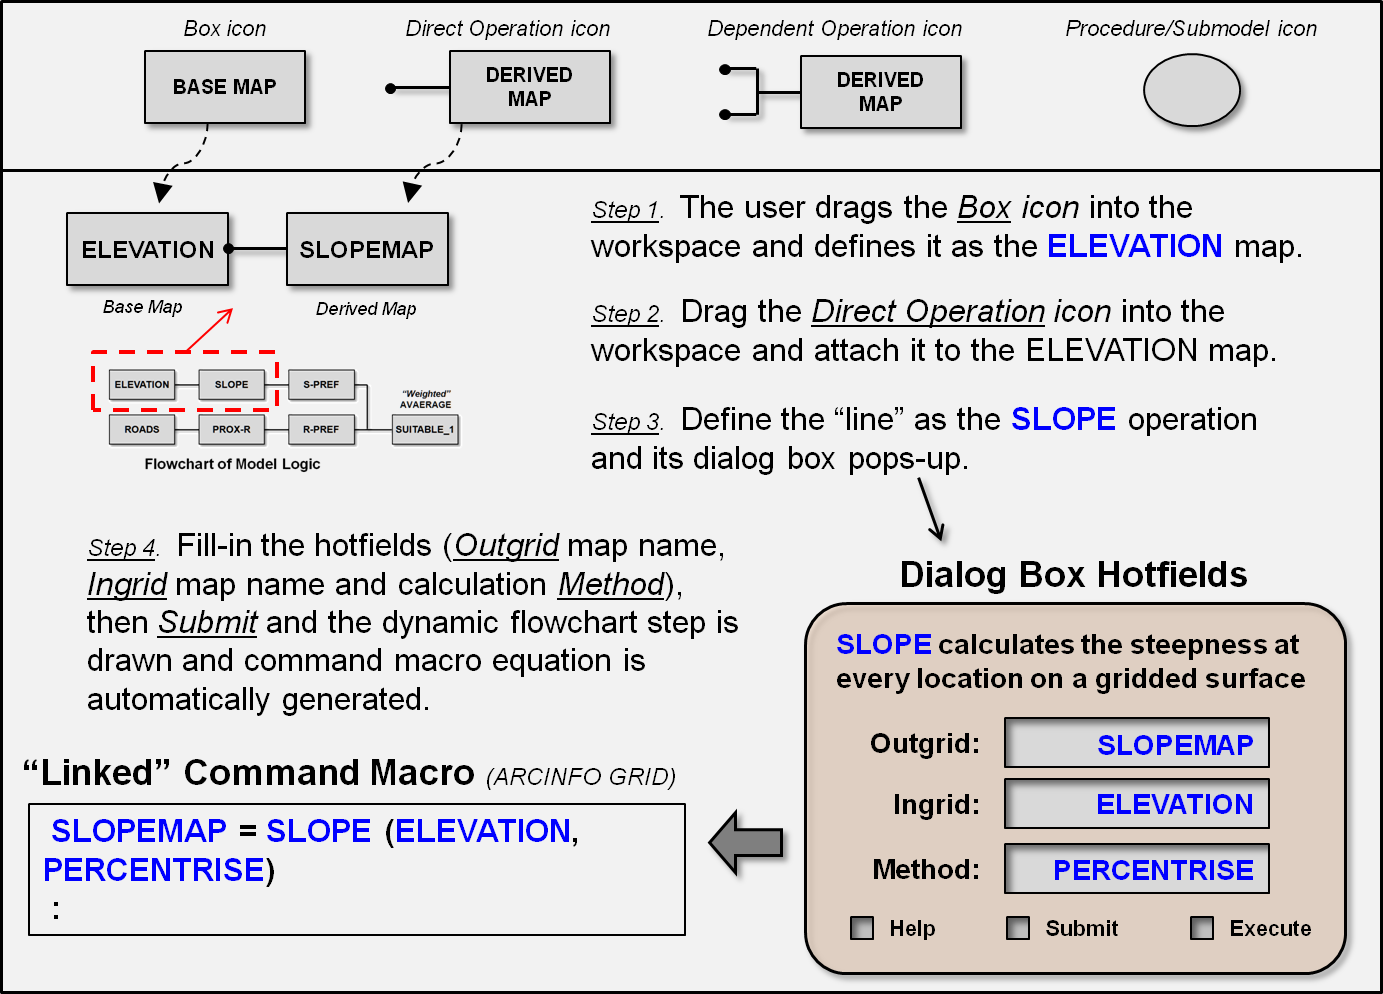
Figure
1. The GIS toolkit of the future may allow the
modeler to generate fully indexed macros by simply constructing an
application’s flowchart.
For
example, the modeler might click and drag the box icon, representing a base
map, into the work space. Once positioned, the box is defined as the Elevation
map. The system searches the database
and associates the mapped data with that element of the flowchart (Step
l). Clicking on the box at any time
pops-up a description and/or display of the map. To continue flowchart construction, the
modeler drags the Direct Operation icon and attaches it to the Elevation map
(Step 2). At that point, the system
knows a new map is desired, but it doesn't know what operation to use.
The
modeler defines the line as the SLOPE command, which causes the system to draw
an empty output map box and pop up SLOPE's dialog box (step 3). The example indicates the options for
Environmental Systems Research Institute Inc.'s ARC/INFO GRID command. The hotfields are specified for
"out-grid" and "method."
It already knows the "ingrid,"
unless you want to change it. The
completed dialog box is submitted, which causes the command line to be written
to the macro and the out-grid name placed in the flowchart (Step 4). The process is repeated to construct
subsequent parts of the model.
Note
that not all widgets are the same. Some
are related to data (maps), some to methods (GIS commands) and their properties
(command options), while others can identify procedures (frequently used submodels). These
terms are in the realm of what computer scientists call object-oriented programming.
It suffices to say that the basic structure for a humane GIS is in
place, but there is a lot of work and discussion before it arrives on your
desk.
Continuing
with the example model's construction, a modeler might attach and identify the
RECLASS operation to the SLOPE map.
Complete its hotfields by assigning preferences to various slope classes
and designate S-PREF as the outgrid. In GRID syntax, a "remap" table is
generated and linked to the RECLASS command line. Other systems will write the reclassification
assignments as part of the command line.
That
trivial point, however, raises a more important point. The GIS industry has made great strides in
establishing standards for data exchange.
It wasn't too many years ago that maps in one system couldn't be fed to
another. If your temples aren't gray,
you probably can't imagine such a silly state of affairs. A database Tower of Babble severely limited
GIS’s potential.
But
what about system-specific application models? It's part of the GIS mystique, isn't it? Part of the insider knowledge that makes your
GIS union card so valuable. Part of the
product differentiation strategy that ensures system loyalty. It's also part of the evolutionary
progression toward open systems. Just as
database management systems evolved Standard Query Language (SQL) to give a
similar look and feel to their users, a GIS Analysis Language (GAL) is the next
step in GIS technology.
Because
GIS is graphical anyway, why not use a dynamic flowchart i
a map's pedigree as the entry point? To
users and modelers alike, the flowchart entry would be similar among systems,
even if the attached command lines were radically different. That will require an extraordinary effort,
similar to the development of geographic standards for the paper map and the
exchange standards for the digital map.
Yet the payoff is huge. Tackling
GIS at the command line level is a superhuman effort. Keep in mind that the millions of potential
GIS’ers are real people who simply need a humane GIS.
__________________________
(Back
to the Table of Contents)