|
Topic 3 –
Implementing GIS |
Spatial Reasoning
book |

Question GIS before You Start — discusses the importance of an
Information Needs Assessment (INA) and a GIS Reality Assessment (GRA)
What Can GIS Do for You? — identifies
and discusses the seven basic types of questions addressed by GIS technology
Build It and They Will Come
— describes
the tactical and conceptual considerations in GIS implementation
<Click here> for a printer-friendly version of this topic
(.pdf).
(Back to the Table of Contents)
______________________________
Question GIS before You Start
(GeoWorld, April 1994)
GIS can
answer all of your questions— at least that's what we hear from overzealous
marketers. True, GIS has resounding
success in many areas, but it also meets with expensive and embarrassing
failures in others. Is there any pattern
to the technology’s successes and failures?
What types of applications have high probability of success? Which are doomed to be duds? What conditions affect the likelihood of
success? How can you mitigate these
conditions?
These
are the real questions surrounding GIS; you need to grapple with them before
you break the shrink wrap on your new system.
The starting point is an Information Needs Assessment (INA), which
envisions GIS products, then works backward to derive the intermediate and base
maps supporting each product. The
process involves four steps:
1.
List
the application areas to which GIS might contribute.
2.
For each application area, describe specific GIS outputs to include
a sketch and legend of the final map.
3.
For each final map, determine its base maps by successively deriving its supporting maps
(with sketch and legend) and the GIS analysis tools needed at each step.
4.
Construct
two tables
summarizing the number of times each base map and each GIS tool are referenced
in the various proposed applications.
The INA
process is best done with a large group of end users, rightly sprinkled with
GIS specialists. The role of the end
users is to “blue-sky-it” and envision what they need, not simply state
what they do and currently produce. The
role of the GIS specialist is to stimulate new approaches and assist in
deriving the supporting maps and identifying the GIS tools required. In most instances the INA is where the GIS
rubber finally meets the application road.
It translates GIS rhetoric into the specific context of the
organization. Often the INA also can
transform into a psychological home run, because it encourages end-user
participation and builds a vested interest in GIS at the grassroots level.
As an
example of the thought process, consider a map of sensitive areas for resource
planning. An end user might envision the
map as a set of contiguous polygons that divide a project area into high,
medium, and low sensitivity. The user
sketches such a map and assigns values l, 2, and 3, respectively. Next, consider what sort of maps might
contribute to the final map. These might
include a map of relative visual exposure to roads with areas of high visual
exposure identified as high sensitivity.
Now
you've identified your first GIS tool (renumber) and supporting map (Vexpose). Sketch the
map of visual exposure to roads. It is
continuous data expressed in raster format, with values increasing from zero
(never seen) to large values (seen a lot) assigned to each grid space. So how could you create such a map? You need to RADIATE a map of roads over a map
of elevation. This step identifies two
input maps (Roads and Elevation) and another GIS tool (radiate). Sketching these maps focuses attention on the
level of detail required. Are different
types of roads needed? What about
trails? Are there special scenic
turnouts you need to consider? Relate
these concerns to the actual numbers that will represent the map features.
Now
where are you going to get the maps? Buy
them if you can; encode them if you can't.
They represent base maps (facts on the landscape), the lowest level of
abstraction in a spatial model. You have
hit ground zero for this component of mapping sensitivity. What other factors need to be considered—
terrain steepness, special habitat areas, proximity to
human activity? Repeat the process of
distilling the base maps from the conceptual maps for each consideration. Then tackle another GIS product in a similar
manner.
When you
complete them all (or reach the point of exhaustion), summarize the
results. The listing of base maps gives
you a handle on database design-which maps are needed, their relative
importance, what level of detail, etc.
The listing of GIS tools gives you a handle on system design— data
loading levels, networking requirements, functionality needed, etc. The "logical fabric" from the
distillation of each GIS product gives you a handle on the application modeling
effort-type of model, relative degree of difficulty, common intermediate maps,
etc. More importantly, the intellectual
exercise raises the general awareness of GIS, generates vested interest in its
successful implementation, and identifies in-house zealots/champions who will
carry the flag.
The results
of the INA process directly lead to a second phase of analysis: the development
of a GIS Reality Assessment (GRA). That
is where the "blue-sky visions" are hammered into a business model
commensurate with the organization's resources and culture. The process involves three steps:
1. Develop
an implementation scenario for
meeting the GIS products identified in the INA process.
2. Determine
how and how much it will cost to acquire
the data and capabilities implied by the scenario.
3. Repeat
steps l and 2 until a "realistic" implementation plan emerges.
The
GRA process is best done with a working group of managers and a small
contingent of GIS specialists. The
managers identify the various priorities and tradeoffs among the array of
possible GIS products. The GIS
specialists tackle the cost of the system, database, and application modeling
implied for each scenario. The
"realistic" implementation plan should contain a timeline that meets
all of the viable GIS products needed— it's just how and how quickly you buy
into it. For example, a solution might
fully implement one unit (e.g., research), then bring
on the other units. Another
organization's solution might be to partially implement all units (e.g.,
inventory capabilities), then expand to more advanced capabilities and
applications identified in the GIS products.
An
alternative to the INA/GRA process is the "fish-or-cut-bait” scheme of
buying a GIS and seeing what happens.
Like casting a seed to the wind, if it happens to land in a fertile
place a sturdy tree will grow. But keep
in mind that nature produces thousands of seeds so just one might
flourish.
__________________________
Author’s
Note: see Both
Dreams and Nightmares Are Born of Frustration, May-July 1992
that discusses the limitations of traditional cost/benefit analysis in
evaluating the adoption of a radically new technology like GIS).
What Can GIS Do for You?
(GeoWorld, May 1994)
GIS
raises as many questions as it answers— maybe more. As a general rule, the confusion surrounding
GIS implementation is inversely proportional to the effort spent in assessing
what it can do. Some say it can do
everything; some say it can only mess things up. The previous section described a two-part
methodology for realistically assessing what GIS can do for you. An important ingredient of the process is an
understanding of the basic questions GIS can answer. Table l identifies seven questions
encompassing most implementations. The
questions are ordered progressively from inventory-related (data) to
analysis-rerated (understanding) as identified by their function and approach.
The
most basic question, “Can you map that?”
is where GIS began thirty years ago— automated
cartography. A large proportion of
GIS applications still involve updating and outputting map products. As an alternative to a room full of
draftspersons and rapidograph pens, the digital map
is a clear winner. Applications that
respond to this question are identified easily in an organization and
productivity "payoffs” are apparent.
These mapping applications often are restatements of current
inventory-related activities.
Questions
involving “Where is what?” exploit
the linkage between the digital map and database management technology. These questions are usually restatements of
current practices and can get a group to extend their thinking to geographic
searches involving coincidence of data they never thought possible. The nature and frequency of such questions
provide valuable insight into system design.
For example, if most applications require interactive map queries of a
corporate database from a dispersed set of offices, you have a major networking
headache in store. If the mapping and
geo-queries are localized and turn-around for the products not demanding, a
simple “sneaker net” might be adequate.
Table 1. There are seven types of questions addressed by
GRA. The first is three are inventory-related; the latter four are
analysis-related and investigate the interrelationships among mapped data
beyond simple coincidence.
|
What GIS Can Do for
You |
||
|
Questions
for GIS |
Function |
Approach |
|
1. Can you map that? 2. Where is What? 3. Where has it changed? 4. What relationships exist? 5. Where is it best? 6. What affects what? 7. What if…? |
Mapping Management Temporal Spatial
Interactions Suitability System Dynamics Simulation/Scenarios |
DATA (Inventory) INFORMATION (Analysis) UNDERSTANDING |
“Where has it changed?” questions involve
temporal analysis. These questions mark
the transition from inventory-related data searches to packaging information
for generating plans and policies. Such
questions usually come from managers and planners, whereas the questions noted
previously tend to support daily operations.
A graphic portrayal of changes in geographic space, whether of product
sales or parts per million of lead in well water, affords a new perspective on
existing data. The concept of
"painting" data, which normally are viewed as tables, might initially
be a bit uncomfortable. That's where GIS
evolves from simply automating current practices to providing entirely new
tools for visualizing and analyzing mapped data.
Questions
of “What relationships exist?” draw
heavily from the GIS toolbox of analytic operations. How far is it from here to there? Can you see the development from over
there? How steep is it? Is the cover type more diverse here or
there? These are a few examples of that
type of question. Whereas the earlier
questions involved querying and repackaging base data, spatial relationship questions
involve derived information. Uncovering
these questions is a bit like the eternal question “Did the chicken or the egg come first?” If you don't know what GIS can do
differently, chances are you aren't going to ask it to do anything
different. How many times have you heard
a land use planner say, "I need a weighted visual exposure density surface
before we can locate the power”?
Suitability
models springs from questions of “Where
is it best?” Often these questions
are the end products of planning and are the direct expression of goals and
objectives. The problem is that spatial
considerations historically are viewed as input to the decision process— not
part of the "thruput." Potential GIS users tend to specify the
composition (base and derived maps) of "data sandwiches" that adorn
the walls during discussion. The idea of
using GIS modeling as an active ingredient in the discussion is totally
foreign. Suitability questions usually
require the gentle coaxing of the INA process described in the previous
section.
Questions
of “What affects what?” involve
system models— most frequently the realm of the scientist and engineer. In a
manner of speaking, a system model is like an organic chemist's view of a
concoction of interacting substances, whereas a suitability model is analogous
to the recipe for a cake. The tracking
of "cause and effect" and reliance on empirical relationships are the
main ingredients of what affects what modeling.
The same hurdle in identifying these applications exists: the perception
that GIS simply provides input. The last
100 years have been spent developing techniques to best aggregate spatial
complexity (e.g., stratified random sampling).
The idea that GIS modeling retains spatial specificity and responds to
spatial autocorrelation in geographic space is a challenging one for
scientists, as well as for managers and the general public.
Questions
involving “What if...?” involve the iterative processing of suitability or
system models. For suitability models,
they provide an understanding of different perspectives on a project. If visual impact is the most important
consideration, where would it be best for development? What if road access is most important? For system models, they provide an
understanding of uncertain or special conditions. What would be the surface runoff if there was
a 2-inch rainstorm? What if the ground
was saturated?
In
asking what GIS can do for you, the first impulse is to automate what you
do. The stretch to find if any of the
other basic questions apply to your business model will give you an idea of what
GIS can really do for you— likely a lot more than you initially think as it a
whole new way of doing business.
Build It and They Will Come
(GeoWorld, June 1994)
To many
people, GIS is simply a hot new technology that should be implemented in every
organization. To the more deliberate
types, it is a new technology that should be viewed with great suspicion. Regardless of your orientation, it's the
implementation phase that makes or breaks GIS in any organization. There are four basic considerations in
implementing GIS: hardware/software, database, appreciation models and human
impacts (see figure 1).
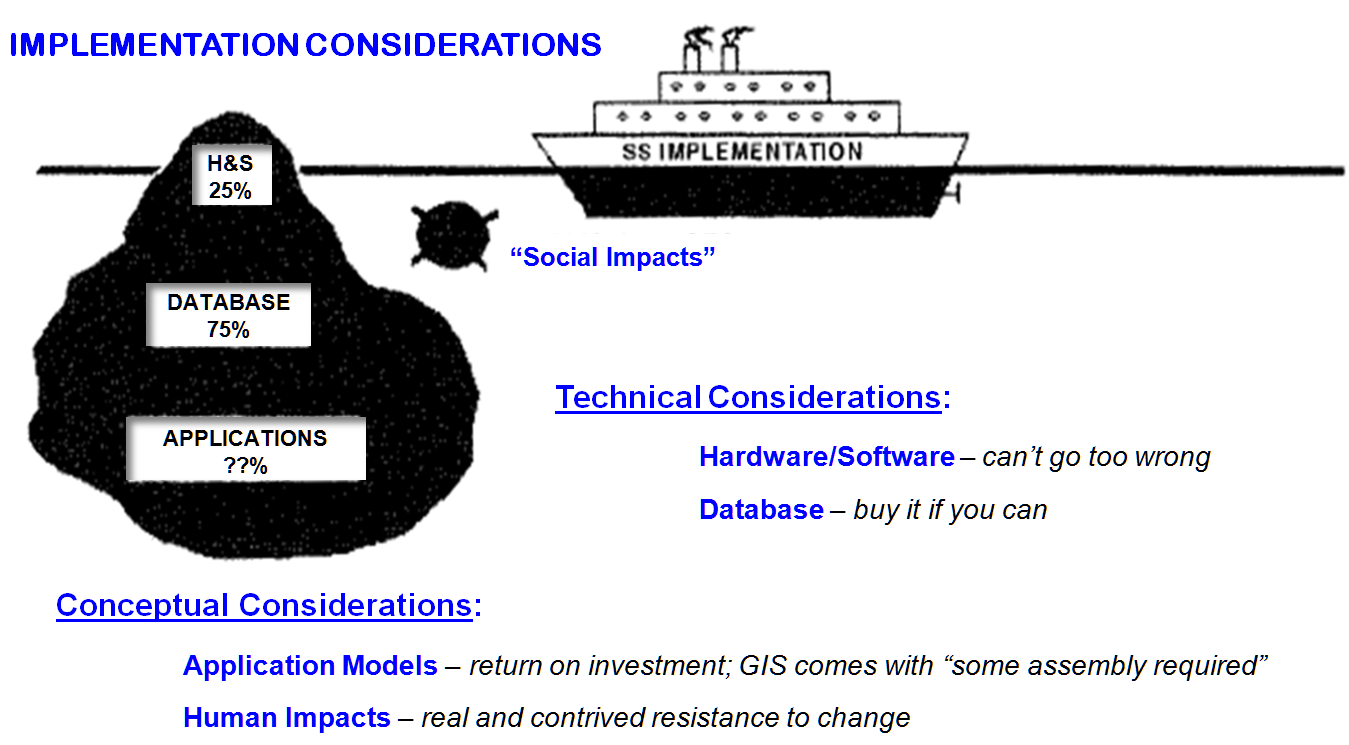
Figure
1. There
are four basic considerations in implementing GIS: hardware/software,
database, application models and human impacts.
Selecting
appropriate hardware/software often receives disproportionate attention. In part, the technical aspects provide a
comfortable setting for meticulous evaluation-storage capacity, processing
speed, and real dollars easily are defined.
What is often overlooked, however, is the dynamic nature of
hardware/software factors. Hardware is
in constant flux, and what's considered a technical (or price) barrier today
becomes commonplace in tomorrow's boxes.
The same holds true for software, as GIS packages continue to leap-frog
capabilities with each update.
As a
general rule, the larger the organization the more effort is spent on scoping
hardware/software. Large government
procurements approach "cyber-seizer," because by the time they
finally compile a detailed specification, a new generation of technology hits
the street. GIS software, however, still
commands product loyalty amid a quagmire of different user interfaces. This Tower of Babble has yet to be breached,
but the exchange of data is a nonissue.
Keep in mind that you can't go too wrong, because when you scrap your
computer in a couple of years you can jump to a new GIS package without losing
your database as hardware/software is semi-fluid, but not necessarily
quicksand.
Your
database, however, is a long-term commitment.
Also, it represents the lion's share of the bag of gold necessary to
acquire GIS. The best advice is to buy
it if you can; encode it if you have to.
An increasing amount of mapped data is available in digital form, such
as the U.S. Geological Survey's Digital Line Graph (DLG) and Digital Elevation
Model (DEM) maps. These data have two
advantages— they are cheaper and sanctioned.
In-house encoding has such a steep learning curve that it's impractical
in most instances. Out-house encoding is
viable for special maps and data not available in digital form. However, keep in mind that any specially
encoded map could be questioned as to whether it's as accurate as the de-facto
standard everyone else uses. Can you
afford to be the oddball? A wary eye
should be cast upon any specialty map nominated for encoding.
The
technical considerations of hardware/software and database development usually
consume most (if not all) of implementation planning. In reality, the conceptual considerations
have a greater impact on successful GIS implementation. As shown in figure 1, most GIS costs are
hidden and difficult to estimate, with the readily identifiable
hardware/software costs just the tip of the iceberg.
The
previous two sections emphasized that scoping of the GIS products and
procedures needed in your organization should drive the implementation process,
not system considerations alone. GIS
comes with "some assembly required" beyond system setup and database
compilation, and model development often sinks the ship.
The
development of application models is where GIS's return on investment
occurs. The process involves writing
command macros in the selected GIS language.
For the uninitiated, that step seems nearly impossible, with a stack of
reference manuals sustaining the steep learning curve. For the cyber-phobiac,
the step is impossible and met with fervent resistance.
As with
database encoding, you can choose to develop your application models either
in-house or out-house. If you choose
in-house development, you need to allow for new hires or considerable time for
retreading existing personnel. If you
choose out-house development, you need to factor in the difficulties in
communication, lack of self-determination and a continuous cost stream. Most organizations straddle the issue and
hire a consultant to develop a basic set of application models with the active
participation of their own GIS specialists in waiting. These on-the-job-training expenses (both in
dollars and time) take many GIS planners by surprise. In addition, application models are software
specific and increasingly lock you into your GIS package. You can easily flush your platform and
transfer your database, but reworking your models into another GIS package is a
major undertaking.
Keep in
mind that without useful models, the GIS platform and database is like an
expensive boat gassed up with high octane fuel, but missing a driver and place
to go. Application models provide the
utility to a GIS. But even with the best
platform, database, and models, you still aren't assured success. The human factor is like a floating mine waiting to sink the ship. If end users see GIS as unfamiliar, overbearing,
obtrusive, and threatening, you're doomed from the start. The problem is that's an accurate description
of GIS for someone outside the technology.
As much
attention and concerted effort is needed for developing user acceptance as is
paid to the hardware/software and database issues. The social sciences have been wrestling with
the human impacts of technology for years.
However, most GIS planning pays little more than lip service to these
concerns. Traditionally, the technical
considerations receive the most attention in GIS implementation planning. But in reality the conceptual considerations
are the real determinants of success.
Therein lays the weak link in GIS implementation. It's like the field of dreams prophecy—
“build it (a GIS) and they (uses and users) will come.”
(back to the Table of Contents)