Optimal Path Analysis and
Corridor Routing: Infusing Stakeholder Perspective in Calibration and Weighting
of Model Criteria
Berry, Joseph K.
Keck Scholar, Geography Department,
Principal,
Email: jberry@innovativegis.com Website: www.innovativegis.com/basis
ABSTRACT
The Least Cost Path (LCP) procedure for routing linear
features was one of the earliest advanced applications of GIS technology. While the technical approach has changed
little from its earliest use, procedures for calibrating and weighting model
criteria have radically changed. Of the
three basic steps in LCP analysis (discrete cost, accumulated cost, steepest
path) the development of a robust discrete cost surface is the most
critical. It is imperative that this summary
map appropriately reflect relative preference for various conditions within
each map layer (calibration) and appropriately balance the relative influence among
the map layers (weighting). Technical
considerations involving a consistent data range, map value normalization and
treatment of exclusion areas are important, however the calibration and
weighting of model criteria are the dominant factors. They also are the most difficult to establish
in a manner that fully engages domain expert and stakeholder perspectives. This paper describes the use of modified
INTRODUCTION
Determining the best route through an area is one of the oldest spatial problems. Meandering animal tracks evolved into a wagon trail that became a small road and ultimately a super highway. While this empirical metamorphosis has historical precedent, contemporary routing problems involve resolving complex interactions of engineering, environmental and social concerns.
In the past, electrical transmission line and other siting applications
required thousands of hours huddling around paper maps, sketching hundreds of
possible paths, and then assessing their feasibility to “eyeball” the best route
using a straight edge and professional experience. While the manual approach capita
ROUTING PROCEDURE
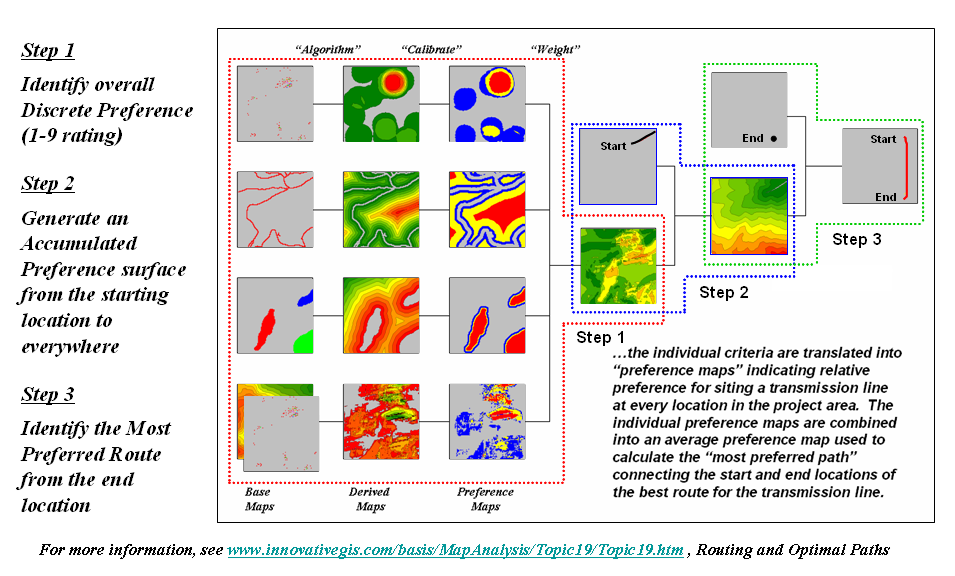
The use of the Least Cost Path (LCP) procedure for identifying an optimal route based on user-defined criteria has been used extensively in GIS applications for siting linear features and corridors. Whether applications involve movement of elk herds, herds of shoppers, or locating highways, pipelines or electric transmission lines, the procedure is fundamentally the same— 1) develop a discrete cost surface that indicates the relative preference for routing at every location in a project area, 2) generate an accumulated cost surface characterizing the optimal connectivity from a starting location (point, line or area) to all other locations based on the intervening relative preferences, and 3) identify the path of least resistance (steepest downhill path) from a desired end location along the accumulated surface. See Author’s Note 1 for more information on applying LCP to routing applications.
Figure 1. GIS-based routing uses three steps to
establish a discrete map of the relative preference for siting at each
location, generate an accumulated preference surface from a starting
location(s) and derive the optimal route from an end point as the path of least
resistance guided by the surface.
Figure 1 schematically shows a flowchart of the GIS-based routing procedure for a hypothetical example if siting an electric transmission line that avoids areas that have high housing density, far from roads, near or within sensitive areas and have high visual exposure to houses.
These four criteria are shown as rows in the left portion of the figure. The Base Maps are field collected data such as elevation, sensitive areas, roads and houses. Derived Maps use computer processing to calculate information that is too difficult or even impossible to collect, such as visual exposure, proximity and density. The discrete Preference Maps translate this information into decision criteria. The calibration forms maps that are scaled from 1 (most preferred—favor siting, grey areas) to 9 (least preferred—avoid siting, red areas) for each of the decision criteria.
The individual cost maps are combined into a single map by averaging the individual layers. For example, if a grid location is rated 1 in each of the four cost maps, its average is 1 indicating an area strongly preferred for siting. As the average increases for other locations it increasingly encourages routing away from them. If there are areas that are impossible or illegal to cross these locations are identified with a “null value” that instructs the computer to never traverse these locations under any circumstances.
IDENTIFYING
CORRIDORS
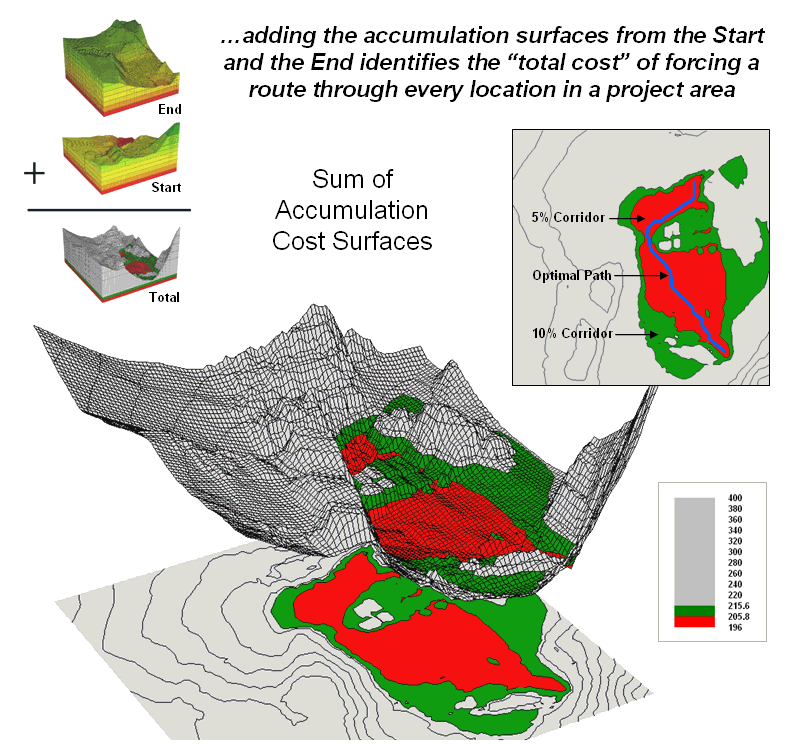
The technique generates accumulation surfaces from both the Start and End locations of the proposed powerline. For any given location in the project area one surface identifies the best route to the start and the other surface identifies the best route to the end. Adding the two surfaces together identifies the total cost of forcing a route through every location in the project area.
Figure 2. The sum of accumulated surfaces is used to
identify siting corridors as low points on the total accumulated surface.
The series of lowest values on the total accumulation surface (valley bottom) identifies the best route. The valley walls depict increasingly less optimal routes. The red areas in figure 2 identify all of locations that within five percent of the optimal path. The green areas indicate ten percent sub-optimality.
The corridors are useful in delineating boundaries for detailed data collection, such as high resolution aerial photography and ownership records. The detailed data within the macro-corridor is helpful in making slight adjustments in centerline design, or as we will see next month in generating and assessing alternative routes.
CALIBRATING ROUTING CRITERIA
Implementation of the LCP routing procedure provides able room for interpretation and relative preferences. For example, one of the criteria in the routing model seeks to avoid locations having high visual exposure to houses. But what constitutes “high” …5 or 50 houses visually impacted? Are there various levels of increasing “high” that correspond to decreasing preference? Is “avoiding high visual exposure” more or less important than “avoiding locations near sensitive areas.” How much more (or less) important?
The answers to these questions are what tailor a model to the specific circumstances of its application and the understanding and values of the decision participants. The tailoring involves two related categories of parameterization—calibration and weighting.
Figure 3.
The
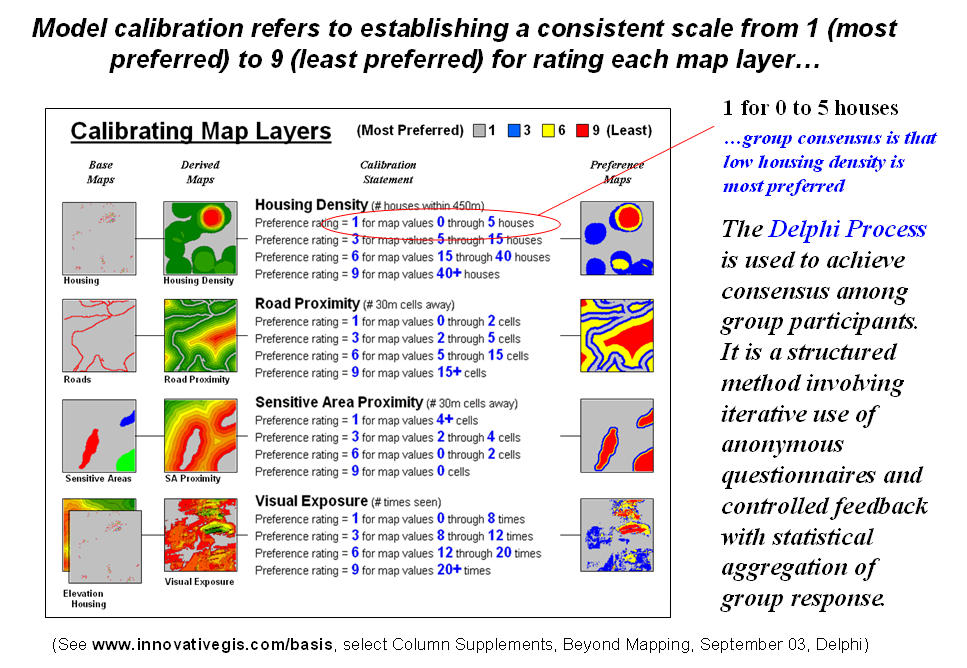
Calibration refers to establishing a consistent scale from 1 (most preferred) to 9 (least preferred) for rating each map layer used in the solution. Figure 3 shows the result for the four decision criteria used in the routing example.
The Delphi Process, developed in the 1950s by the Rand Corporation, is designed to achieve consensus among a group of experts. It involves directed group interaction consisting of at least three rounds. The first round is completely unstructured, asking participants to express any opinions they have on calibrating the map layers in question. In the next round the participants complete a questionnaire designed to rank the criteria from 1 to 9. In the third round participants re-rank the criteria based on a statistical summary of the questionnaires. “Outlier” opinions are discussed and consensus sought.
The
development and summary of the questionnaire is critical to
WEIGHTING CRITERIA MAPS
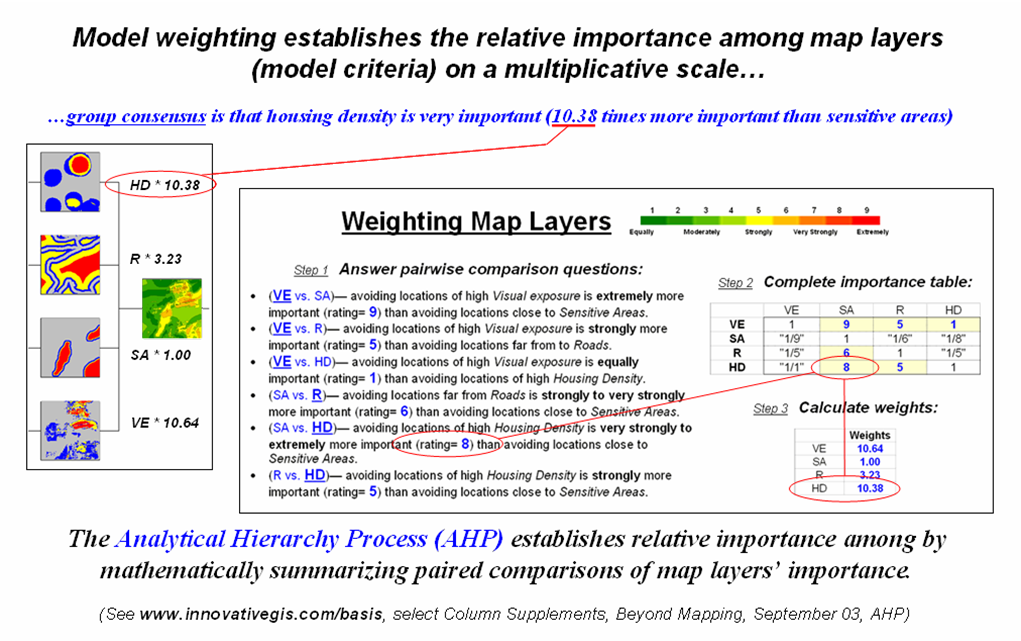
Weighting of the map layers is achieved using a portion of the Analytical Hierarchy Process (AHP) developed in the early 1980s as a systematic method for comparing decision criteria. The procedure involves mathematically summarizing paired comparisons of the relative importance of the map layers. The result is a set map layer weights that serves as input to a GIS model.
Figure 4. The Analytical Hierarchy Process uses pairwise comparison of map layers to derive their relative importance.
In the routing example, there are four map layers that define the six direct comparison statements identified in figure 3 (#pairs = (N * (N – 1) / 2) = 4 * 3 / 2= 6 statements) as shown in figure 4. Members of the group independently order the statements so they are true, then record the relative level of importance implied in each statement. The importance scale is from 1 (equally important) to 9 (extremely more important).
This information is entered into the importance table a row at a time. For example, the first statement in the figure views avoiding locations of high Visual Exposure (VE) as extremely more important (importance level= 9) than avoiding locations close to Sensitive Areas (SA). The response is entered into table position row 2, column 3 as shown. The reciprocal of the statement is entered into its mirrored position at row 3, column 2. Note that the last weighting statement is reversed so its importance value is recorded at row 5, column 4 and its reciprocal recorded at row 4, column 5.
Once the importance table is completed, the map layer weights are calculated. The procedure first calculates the sum of the columns in the matrix, and then divides each entry by its column sum to normalize the responses. The row sum of the normalized responses derives the relative weights that, in turn, are divided by minimum weight to express them as a multiplicative scale. See Author’s Note 2 for more information on calculations and applying AHP to routing applications.
The relative weights for a group of participants are translated to a common scale then averaged before expressing them as a multiplicative scale. Alternate routes are generated by evaluating the model using weights derived from different group perspectives.
EPRI-GTC Transmission Line Siting EXPERIENCE
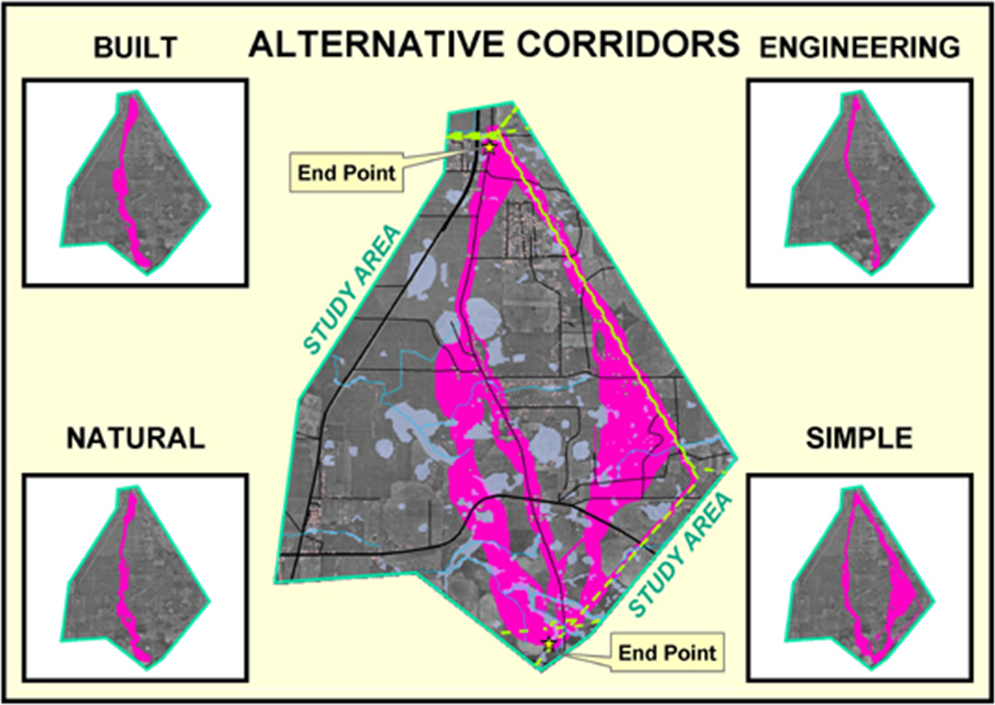
Figure 5 shows the results of applying different calibration
and weighting information to derive alternative routes for a routing
application in central
These results are from a comprehensive model recently
developed during a project funded by the Electric Power Research Institute
(EPRI) and Georgia Transmission Corporation (GTC). The project team consisted of academics,
siting engineers, GIS specialists and various administrators, public relation
personnel, legal advisors and other industry experts. Several group sessions involving federal
agencies, industry representatives and community groups were held that used
While
all four of the routes in figure 5 use the same criteria layers, the
differences in emphasis for certain layers generate different routes/corridors that
directly reflect differences in stakeholder perspective. Note the similarities and differences among
the Built, Natural, Engineering and un-weighted routes. The bottom line is that the procedure
identified constructible alternative routes that can be easily communicated and
discussed.
The
final route is developed by an experienced transmission line siting team who combine
alternative route segments for a preferred route. Engineers make slight centerline realignments
responding the detailed field surveys along the preferred, and then design the
final pole placements and construction estimates for the final route.
Figure 5.
Alternate routes are generated by evaluating the model using weights
derived from different group perspectives. (Courtesy of Photo Science and Georgia
Transmission Corporation)
The ability to infuse different perspectives into the routing process is critical in gaining stakeholder involvement and identifying siting sensitivity. It acts at the front end of the routing process to explicitly identify routing corridors that contain constructible routes reflecting different perspectives that guide siting engineer deliberations. Also, the explicit nature of the methodology tends to de-mystify the routing process by clearly identifying the criteria and how it is evaluated.
In addition, the participatory process 1) encourages interaction among various perspectives, 2) provides a clear and structured procedure for comparing decision elements, 3) involves quantitative summary of group interaction and dialog, 4) identifies the degree of group consensus for each decision element, 5) documents the range of interpretations, values and considerations surrounding decision criteria, and 6) generates consistent, objective and defendable parameterization of GIS models.
CONCLUSION
The use of
Author’s Notes:
1) The online book Map Analysis, Topic 19, “Optimal Paths and Routing” presents a detailed discussion on the Least Cost Path procedure for GIS-based identifying optimal routes and corridors. See…
http://www.innovativegis.com/basis/MapAnalysis/Default.html
2)
Supplemental discussion and an Excel
worksheet demonstrating the calculations are posted at www.innovativegis.com/basis/,
select “Column Supplements” for Beyond Mapping, September, 2003.
·
Delphi and AHP Worksheet an Excel worksheet templates for applying the
·
Delphi Supplemental Discussion describing the application of the
· AHP Supplemental Discussion describing the application of AHP for weighting map layers in GIS suitability modeling
3) The EPRI-GTC transmission Line Siting Model
methodology is discussed in detail in a GeoWorld feature article, April 2004,
and is posted online in the GeoWorld archives at…
The EPRI-GTC project team consists of the author and Dr. Paul Zwick, Chair, Department of Urban and Regional Planning, University of
Florida, Gainsville, Florida, Dr. Steven French, Director, Georgia Tech Center for Geographic
Information Systems, Georgia Institute of Technology, Atlanta, Georgia, Dr. Elizabeth Kramer, Research
Scientist, Institute of Ecology, University of Georgia, Athens, Georgia,
several GIS specials headed by Jesse Glasgow, Senior GIS Analyst, Photo Science Incorporated, Tucker,
Georgia and several siting engineers headed by Gayle Houston, Environmental and
Regulatory Coordinator, Georgia Transmission Corporation, Tucker, Georgia.
______________________
Dr. Joseph K. Berry is the
Principal of