Applying MapCalc Map Analysis Software
Store Competition Analysis: A local storeowner needs to identify the
spatial impact of a new store that is under construction on the other side of
town.
<click
here> for a printer friendly
version (.pdf)
 Note:
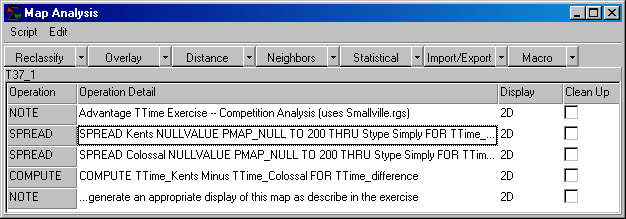
the application is completed in just three MapCalc command lines. The procedure can be automated through an
interactive user interface (e.g., Visual Basic) that accesses the MapCalc
program or the two ActiveX controls (Spread and Calculate) used in the
technique.
Note:
the application is completed in just three MapCalc command lines. The procedure can be automated through an
interactive user interface (e.g., Visual Basic) that accesses the MapCalc
program or the two ActiveX controls (Spread and Calculate) used in the
technique.
<click here> for a printer friendly version
(Competition_scenario.pdf)
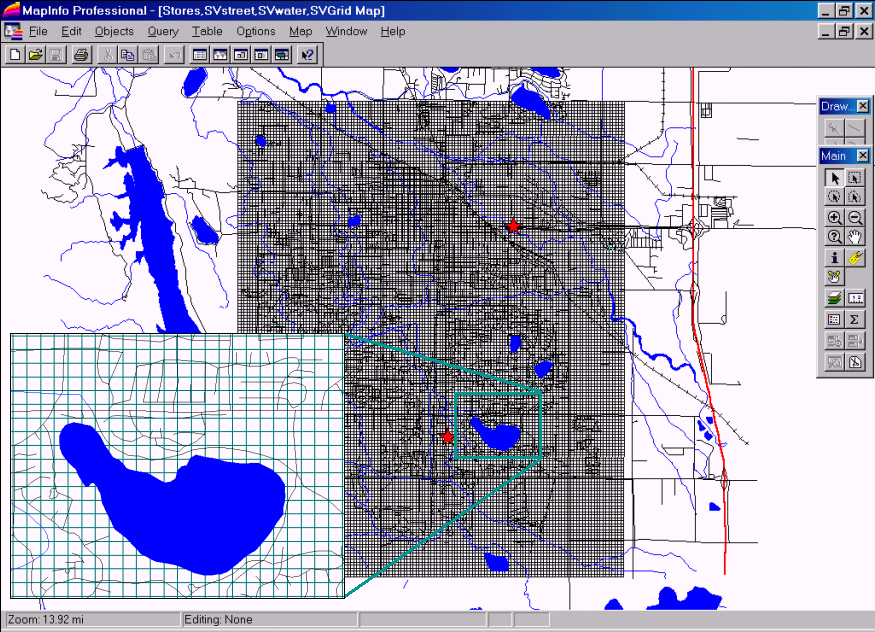
Base Maps. Standard
vector layers of streets and stores (Kent’s Place in the south and the proposed
competitor Colossal Mart in the north) form the base layers for travel-time
analysis.
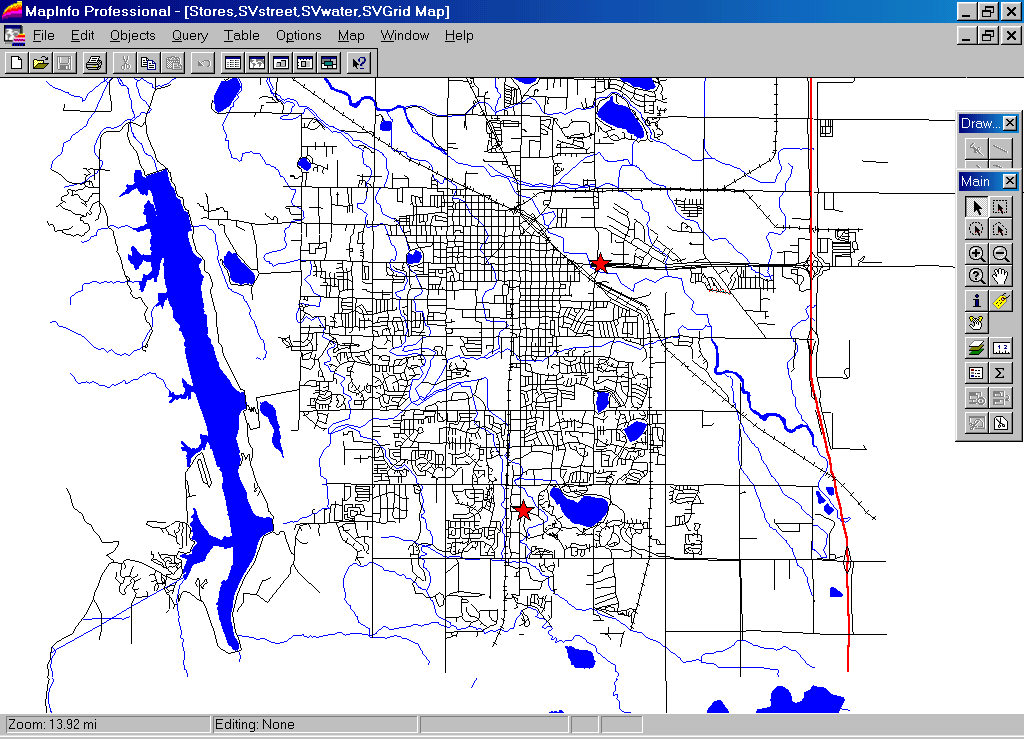 Composite Display. Standard
vector layers of streets and stores (Kent’s Emporium in the south and their
major competitor Colossal Mart in the north… red
dots) form the base layers for travel-time analysis. The lines and points are “burned” into an
appropriate grid analysis frame (vector to raster conversion).
Composite Display. Standard
vector layers of streets and stores (Kent’s Emporium in the south and their
major competitor Colossal Mart in the north… red
dots) form the base layers for travel-time analysis. The lines and points are “burned” into an
appropriate grid analysis frame (vector to raster conversion).
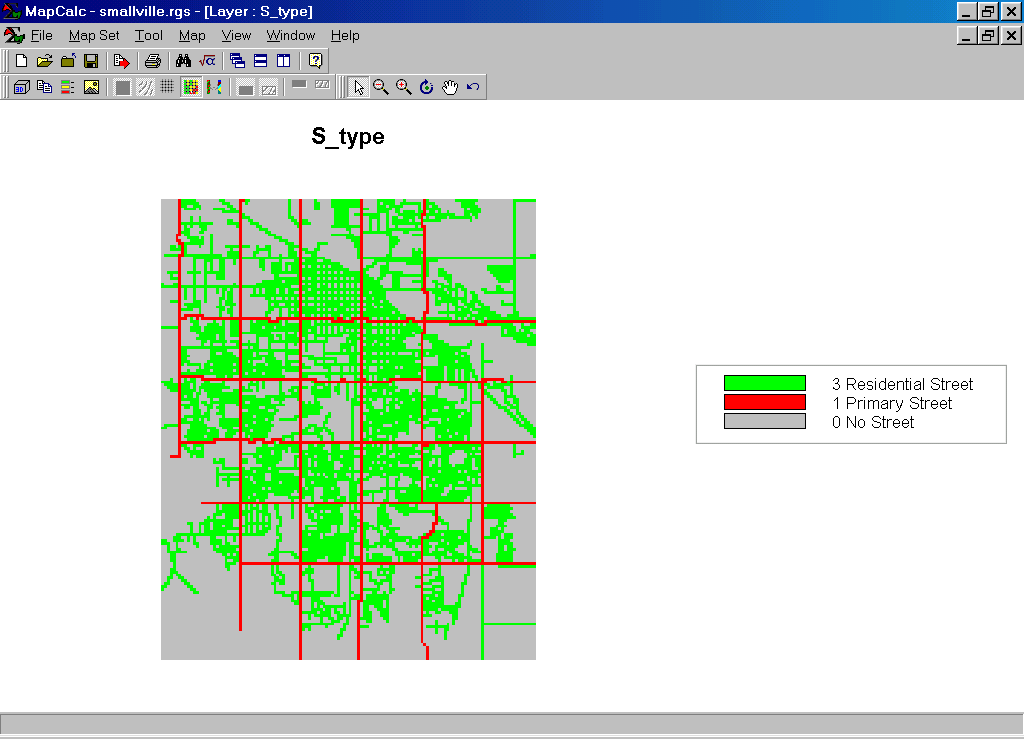 S_type Map. Identifies whether a street is present within
each analysis grid cell with a separate value for the type of street (1=
Primary Street…red; 3= Residential
Street…green; 0= no street… gray).
S_type Map. Identifies whether a street is present within
each analysis grid cell with a separate value for the type of street (1=
Primary Street…red; 3= Residential
Street…green; 0= no street… gray).
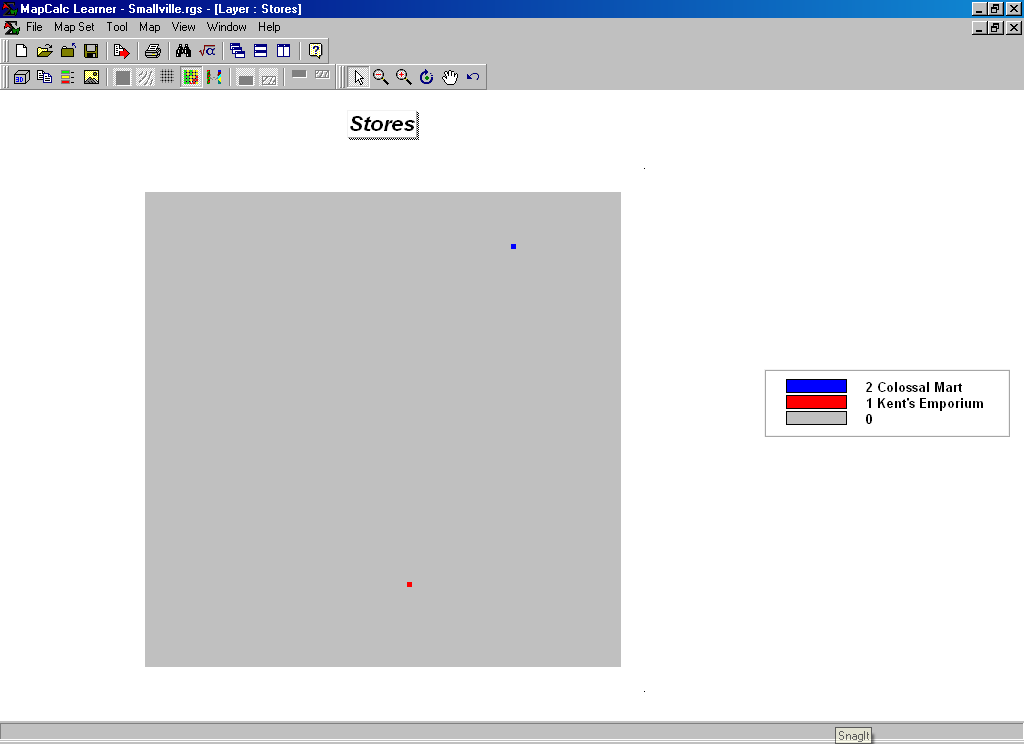 Stores Map. Identifies the location of the stores (1=
Kent’s Emporium…red; Colossal mart…blue).
Stores Map. Identifies the location of the stores (1=
Kent’s Emporium…red; Colossal mart…blue).
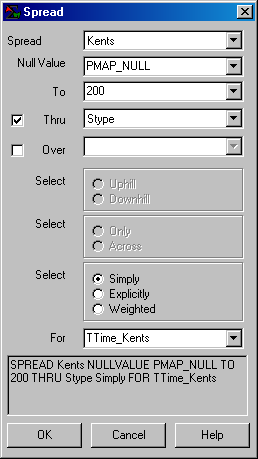
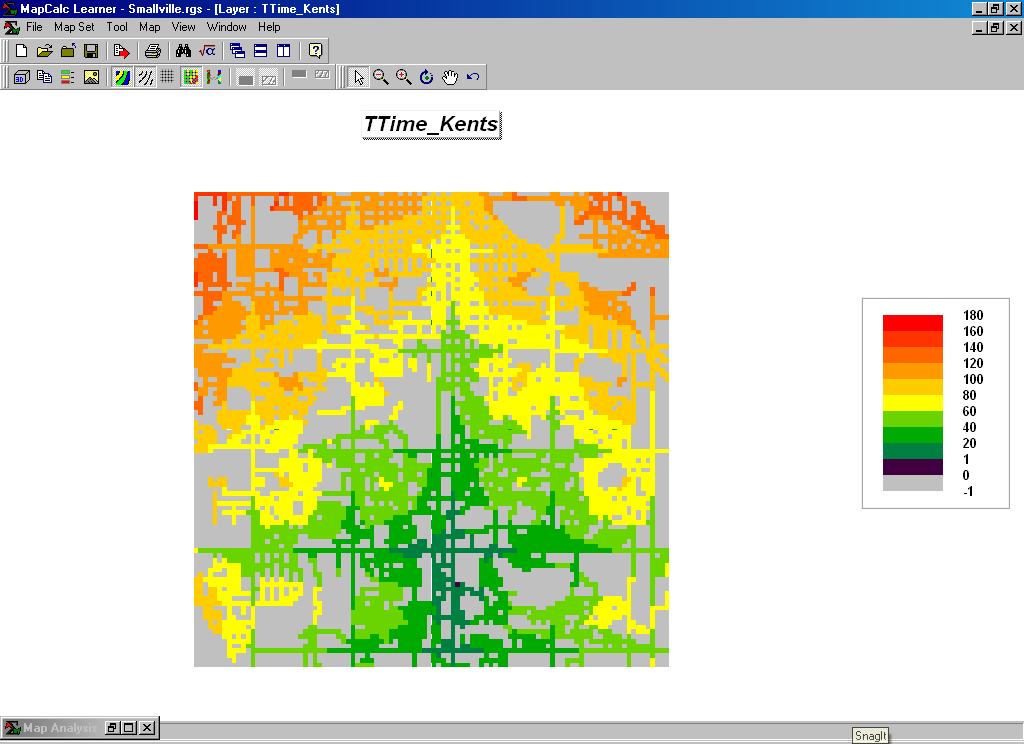
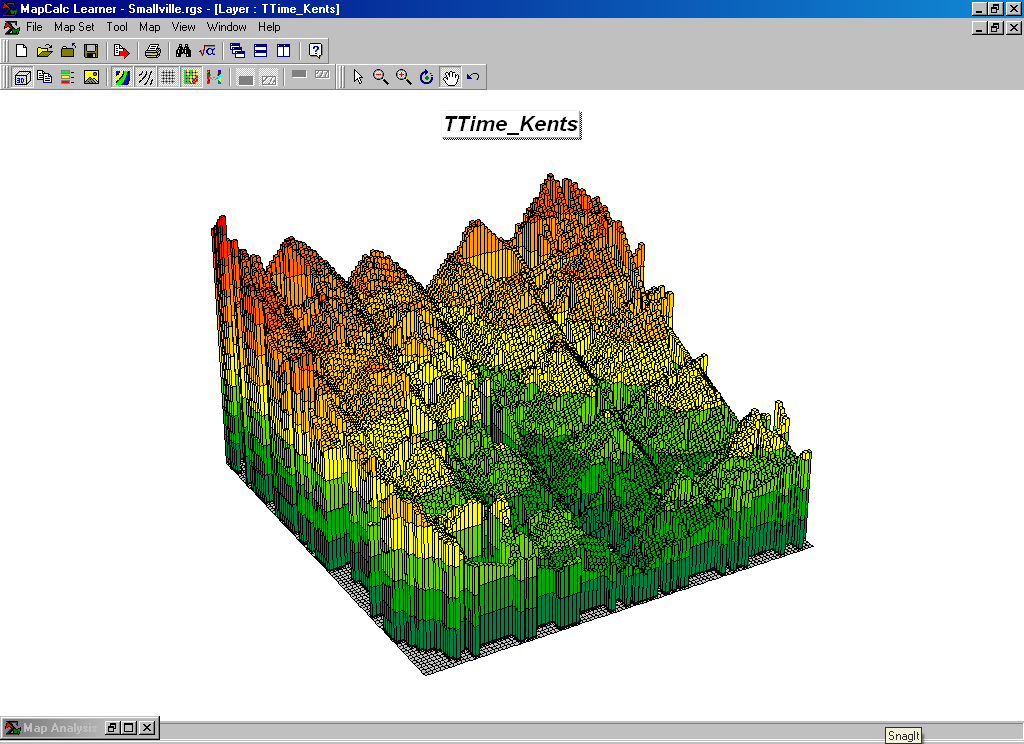
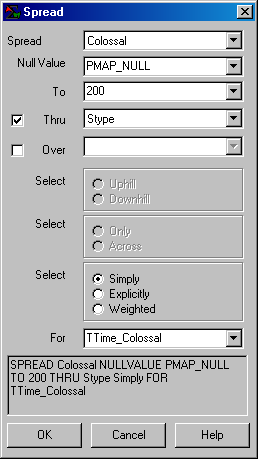
Step 1. Using
the Spread command calculate a Travel-Time surface along
the streets from Kent’s Emporium to all other locations in the project area.
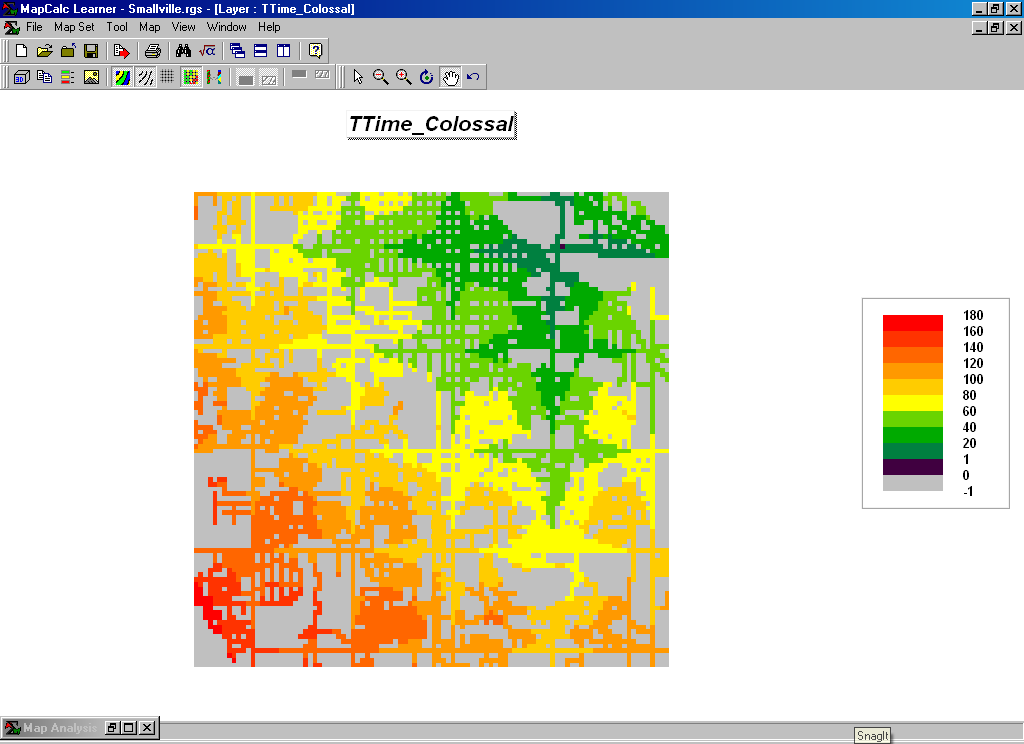
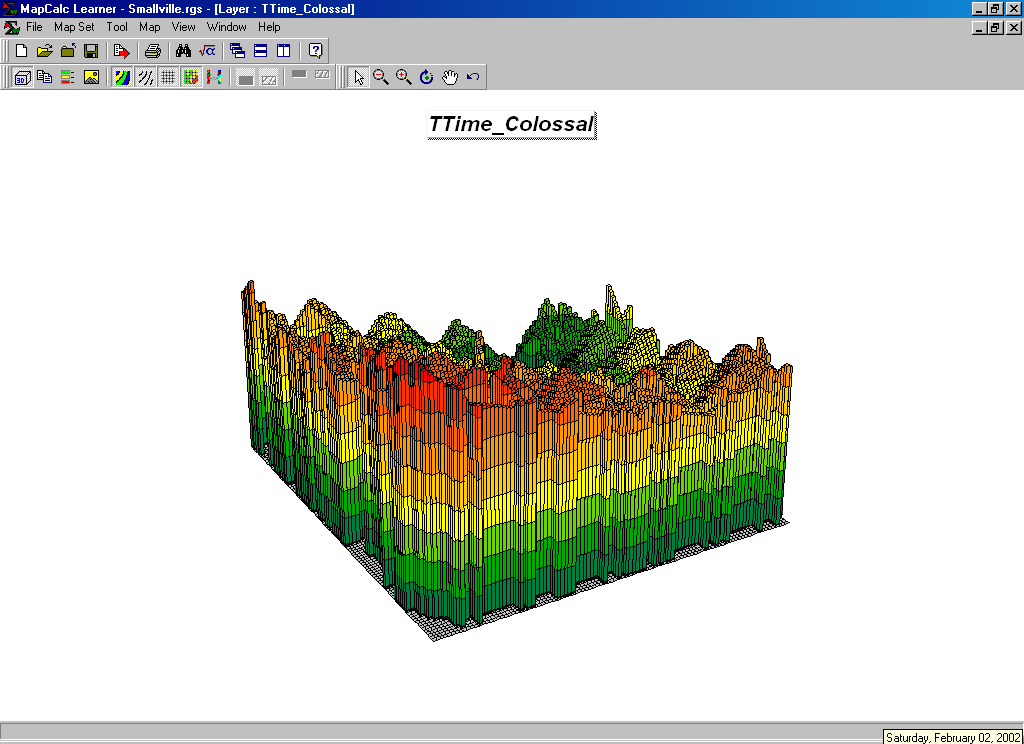
Step 2. The
procedure is repeated to generate a Travel-Time surface for Colossal
Mart.
Step 3. The difference between the two Travel-Time
surfaces is calculated.
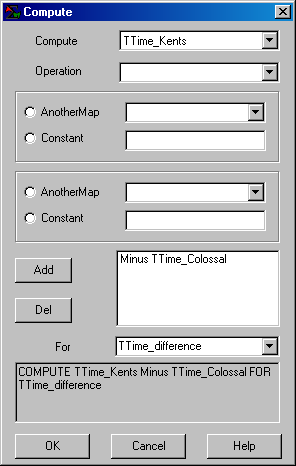
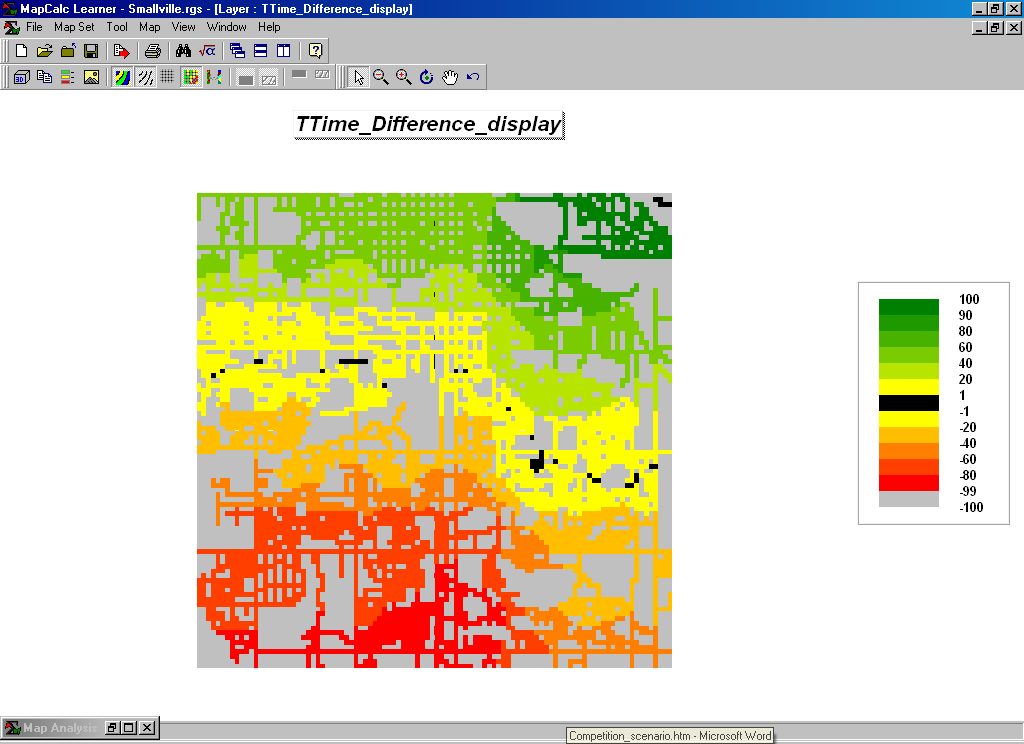
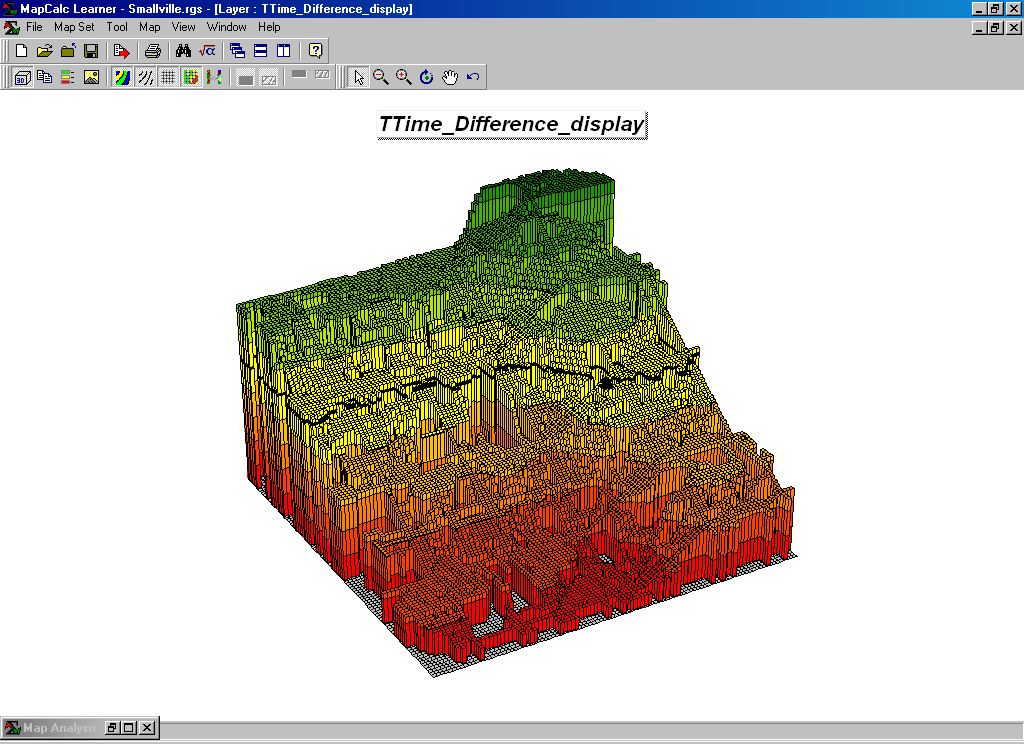 Locations that are the same travel-distance
from both stores result in zero (black).
The green tones on the
difference surface identify positive values where Kent’s travel-time is larger
than its competitor’s—advantage to Colossal mart. Negative values (red
tones) indicate the opposite—advantage to Kent’s Emporium. The yellow
locations identify the Combat Zone where potential customers are about
the same distance from both stores—advantage no one.
Locations that are the same travel-distance
from both stores result in zero (black).
The green tones on the
difference surface identify positive values where Kent’s travel-time is larger
than its competitor’s—advantage to Colossal mart. Negative values (red
tones) indicate the opposite—advantage to Kent’s Emporium. The yellow
locations identify the Combat Zone where potential customers are about
the same distance from both stores—advantage no one.
Summary. Competition analysis enables merchants to visualize the lay of the competitive landscape. However, the information is in quantitative form and can be readily integrated with other customer data. Knowing the relative travel-time advantage (or disadvantage) of every street address in a city can be a valuable piece of the marketing puzzle. Like age, gender, education, and income, relative travel-time advantage is part of the soup that determines where we shop… it’s just we never had a tool for measuring it.
Note: see topic 17 of the online book Map Analysis for
more discussion…
http://www.innovativegis.com/basis/MapAnalysis/Topic17/Topic17.htm