Beyond Mapping III
|
Map
Analysis book with companion CD-ROM
for hands-on exercises and further reading |

An Experiential GIS — discusses
a participatory GIS experience
An Understanding GIS — describes
the translation of mapped data to spatial information for decision-making
Dreams and Nightmares Are Born of Frustration — identifies
concerns with cost/benefit analysis of
GIS Is Never Having to Say You Are Sorry — discusses
several human considerations in implementing GIS
Note: The processing and figures
discussed in this topic were derived using MapCalcTM
software. See www.innovativegis.com to download a
free MapCalc Learner version with tutorial materials for classroom and self-learning
map analysis concepts and procedures.
<Click here> right-click to download and print a
printer-friendly version of this topic (.pdf).
(Back to the Table of Contents)
______________________________
Don’t Forget the Human Factor: An
Experiential
(GeoWorld, July 1996)
It is
often said that "experience is what
you get when you don't get what you want." The corollary to this universal truth is
"learn from other's mistakes, so you
won't have to make them all yourself."
As
Given
this line of reasoning, let me describe an early experience in the application
of
Where
we went wrong was an attempt to address a "real world" problem. The town had recently completed its
Comprehensive Plan of Development and Conservation as a requirement of the
Coastal Wetlands Act. It was the result
of several years effort among citizen groups and town
officials. The plan consisted of
twenty-one policy statements, such as "protect inland wetlands ...from
contamination and other modifications," "preserve farmlands,"
and "encourage development near or within existing developed
areas."
Since
all twenty-one of the statements had a spatial component, it seemed natural to
map the conceptual model embodied in the plan.
Using a three-tier ranking scheme of suitable,
less suitable and unsuitable, each policy statement was
interpreted into a map of suitability for development. For example, the policy to "preserve
farmland" used the town's land use map to identify farmland and then
assign the areas as less suitable.
Similarly, the policy statement to "protect inland wetlands"
caused these areas on the sensitive soil map to be designated as unsuitable. In contrast, the areas near or within existing
development indicated on the land use map were identified as suitable for
development. Following the plan's
organization, the statements were grouped into four submodels
of Water and Sewage, Growth, Preservation, and Natural Land Use, then combined into one overall suitability map.
Near
the end of the term, enthusiasm was high and success seemed imminent. That was until we hosted a town meeting at
the local high school to present the results.
Students served refreshments and proudly stood by their computer-generated maps draping the walls. As fledgling
So what
went wrong? We had done our
homework. We had developed an accurate
database. We had conscientiously
translated their policy statements
into maps and integrated them as implied by their plan. We thought we
had done it all... and we had from a
Being a
slow learner and somewhat bent on self-flagellation, I decided to extend the
project the following year. First, the
students refined both the database and the model, then
determined the most limiting policy goals by systematically relaxing criteria
in successive runs (sensitivity analysis).
Armed with this insight, we solicited the help of the three town
commissions instrumental in the plan's development; the Economic Development
Commission, the Planning and Zoning Commission and the Conservation
Commission. At working meetings,
policy-rating questions were posed to each group and their hierarchical orderings of the policy statements where used
for subsequent model runs.
The
results were three maps of overall suitability, expressing alternative
interpretations of the plan. For
example, the Conservation Commission's interpretation of "protect inland
wetlands" was emphatic. Since it's
damp about everywhere, 83% of the town was deemed unsuitable for
development. The Economic Commission, on
the other hand, believed sound engineering protects wetlands, thereby lowering
the wetland policy's rating, which resulted in only 21% being unsuitable. By simply subtracting the two maps, the
locations of agreement and contention were easily identified. The comparison map and the three alternative
interpretations by the commissions were published in the local paper... "healthy a priori
discussion ensued." Most
importantly, we minimized
The
_______________________
For more on this "watershed"
experience, see Assessing Spatial Impacts of Land Use Plans, by Berry and
Berry, 1988, in Journal of Environmental Management, 27:1-9; and Analysis of
Spatial Ramifications of the Comprehensive Plan of a Small Town, Berry, et. al., 1981, in the proceedings of the 41st Symposium, American
Congress of Surveying and Mapping.
Developing an Understanding
(GeoWorld,
August 1996)
Effective
First,
let's split hairs on some important words borrowed from the philosophers-- data, information, knowledge, and wisdom. You often hear them interchangeably, but they
are distinct from one another in some subtle and not-so-subtle ways.
The
first is data, the "factoids" of our Information Age. Data
are bits of information, typically but not exclusively, in a numeric form, such
as cardinal numbers, percentages, statistics, etc. It is exceedingly obvious that data are
increasing at an incredible rate.
Coupled with the barrage of data, is a requirement for the literate
citizen of the future to have a firm understanding of averages, percentages,
and to a certain extent, statistics.
More and more, these types of data dominate the media and are the
primary means used to characterize public opinion, report trends and persuade
specific actions.
The
second term, information, is closely related to data. The difference is that we tend to view
information as more word-based and/or graphic than numeric. Information
is data with explanation. Most of what
is taught in school is information.
Because it includes all that is chronicled, the amount of information
available to the average citizen substantially increases each day. The power of technology to link us to
information is phenomenal. As proof,
simply "surf" the exploding number of "home pages" on the
Internet.
The
philosophers' third category is knowledge,
which can be viewed as information within a context. Data and information that are used to explain
a phenomenon become knowledge. It
probably does not double at fast rates, but that really has more to do with the
learner and processing techniques than with what is available. In other words, knowledge is data and
information once we can process and apply it.
The
last category, wisdom, is what
certainly does not double at a rapid rate.
It is the application of all three previous categories, and some
intangible additions. Wisdom is rare and
timeless, and is important because it is rare and timeless. We seldom encounter new wisdom in the popular
media, nor do we expect deluge of newly derived wisdom to spring forth from our
computer monitors each time we log on.
Knowledge
and wisdom, like gold, must be aggressively processed from tons of near
worthless overburden. Simply increasing
data and information does not assure the increasing amounts of the knowledge
and wisdom we need to solve pressing problems.
Increasing the processing "thruput"
by efficiency gains and new approaches might.
OK, how
does this philosophical diatribe relate to
Understanding
sits at the juncture between information and knowledge. Understanding
involves the honest dialog among various interpretations of data and
information in an attempt to reach common knowledge and wisdom. Note that understanding is not a
"thing," but a process. It's how
concrete facts are translated into the slippery slope of beliefs. It involves the clash of values, tempered by
judgment based on the exchange of experience.
Technology, and in particular
Our
earliest encounters with
Tomorrow's
This
step needs to fully engage the end-user in
I hope
we consider the importance of knowledge and wisdom in the Information Age, and
eagerly grasp the opportunity
Like
the automobile and indoor plumbing,
Both Dreams and Nightmares are
Born of Frustration
(GeoWorld,
May 1992)
The
dream is that
Your
first step in this process is establishing "where you are coming
from."
There,
that's easy. There is nothing to
it. Just call in the accountants and
they will identify the numbers to plug into the Cost/Benefit equation. The reality is that even a strictly economic
perspective is not that easy. The
comfortable feeling of quantifying the evaluation process is quickly lost to
the pliable nature of the "yardsticks" used to measure the costs and
benefits.
The
time-span used in the analysis is critical.
If it is too short, the stream of benefits is artificially
truncated. The high front-end costs,
combined with the confusion and frustration of implementing a new system, will
far outweigh the benefits. It's like a
bare-knuckle battle between Sylvester Stallone and a tiger cub. If it is delayed a few years, the outcome
will likely be different. If you had
used a two-week cost recovery period for word processing, would you have ever
dropped your pencil?
So what
time period should be used? That's a judgement call-- your judgement
call. Like lying with statistics, you
can choose the time period that insures the answer you want. In general, a longterm
position favors the adoption of
Just as
important (and "mushy") is how you identify and quantify the variables
of the cost/benefit equation. Four cost
considerations quickly surface-- hardware/software, data base
development/administration, training and application models. The hardware figures are the easiest to
quantify through a litany of parameters including MegaHertz,
GigaBytes,
Although
relatively easy to quantify, these figures are fleeting and set you up for a
bad case of "buyer's remorse."
About the time you finally push through your procurement and take first
delivery, your system is out of date.
It's like that pocket calculator.
Within a couple of months, the same expenditure gets you five more keys
at half the price. The difficulty in
nailing down the hardware/software cost component isn't in the definitions, it is keeping your footing in the quicksand of
technology. Like shooting ducks, you had
better have a good lead on your target.
For large, bureaucratic organizations, it may be prudent to just set a
budgetary figure for the "best available technology" and postpone the
specifications to the moment of purchase.
That may seem preposterous, but it may be more realistic.
Data
base development, maintenance and management are not only larger expenses than
hardware and software, but it is even more tricky and slippery to
estimate. Rarely does a simple inventory
of your current map and file cabinets multiplied times an estimate of encoding
costs produce an acceptable cost figure.
The differences between the digital and paper map make it too tricky for
such a mechanical approach. It's prudent
to launch an Information Needs Assessment (INA) to determine data base
contents, structure, policy and costs (a later issue will focus on this
process).
Even if
you do get a good handle on the data base, you must develop,
you're not out of the woods yet. How you
obtain these data is slippery turf. Manual
encoding, scanning or purchasing are your basic options. Not so long ago, in-house, manual encoding
was your only option. More recently the
scales have been tipping toward scanning and purchasing, as a room full of
digitizer folks is a major cost and distraction from normal business
activities. Also, many of the maps you
might encode have time-bombs ticking within them. For example, if you encode (in-house or
contract) a soils map, it will become invalid once the Soil Conservation
Service's "authoritative" version is released. Its back to shooting ducks, you had better
get your data requirements in line and lead them, or you will just be pumping
pellets into the air.
The
costs of training your people to use
One
reaction to this reality is to form a
First,
the
If
costs of training are identified at all, they are usually associated with
vocational instruction on system operations.
But
The
development of application models is the other reason for failure of a
centralized approach. How the new
technology leads to new ways of doing things is the least understood cost (and
benefit) of
The
creative assembly is entirely up to your people. If you ignore or skimp on training and
application model development, you will incur opportunity costs at the
minimum. More likely, you will generate
a backlash of confusion and apprehension that quickly outweighs the set
benefits you identify. A couple of
strategically placed anti-
A
strict economic perspective is the first step in scoping
(GeoWorld,
June 1992)
Most organizations
begin their first step of what seems to be a thousand mile journey to
The
organizational structure (both formal and informal) is an important concern, as
it is the direct expression of the "corporate character"— the most
basic element of any organization. If
extensive individual latitude and autonomy best describes the current
character,
However,
if
Another
concern which may run amuck with the corporate character is the imposition of
data standards. In many organizations,
mapping standards are either non-existent, or merely address geographic
registration and data exchange formats.
But this is just the tip of the chilling iceberg of standards. The ability to export a map from one
A
corporate data base consists of three levels of maps based on their degree of
abstraction-- base, derived and interpreted.
Base maps are usually physical data we collect, such as roads, water and
ownership boundaries. They have minimal
abstraction, and as much as possible, represent a scale model with all of the
detail of a flatten model train set.
Definitions and procedures for mapping most these data are in place...
but not all.
Consider
a map of cover type. Is
Forest/Non-Forest a sufficient standard?
Or should the Forest class be further divided into Conifer and
Deciduous? And the Conifer, in turn,
subdivided into Pine, Fir and Hemlock?
What about age and stocking classes?
Should you identify a lone pine tree in the middle of a meadow as a
Conifer Stand? Two, three, four, five
trees— what does it take to form a forest stand? Ask a forester, ecologist and recreation
scientist and you'll get at least three different responses. Or maybe four or five
different definitions depending on how different applications decipher the
landscape. You'll be sorry if you
don't tackle these questions before you implement
For
example, a wildfire had the audacity to burn across the boundary of two
National Forests. Maps of cover type
were encoded for both Forests, but they couldn't be edge-matched. One Forest had six classes of age and
stocking for Douglas Fir, the other had eight. The
Vested
interests in the definitions of map categories goes
beyond base data. Derived maps, such as
slope, visual exposure and proximity to roads, are physical things. However, the data are too difficult to
collect, so we use the computer to calculate them. Even something as simple as slope calculation
has several algorithms, each with its pros and cons. For something as complex as visual exposure,
there is a quagmire of assumptions, approaches and procedures. Which will you entrench in your system? Rest assured that the choice won't be by
consensus, nor the dissenting voices reserved.
Even
more volatile are the assumptions embedded in interpreted maps. These data are the most abstract, as they are
conceptual renderings of expert opinion.
Taunts of "my elk habitat model is better than yours"
reverberate through the halls whenever two wildlife ecologists are cornered in
the same room. It is naive to assume
that an elk model will edge-match across two forests,
much less an entire region. And certainly not across the paradigm chasm of two experts.
So
whose derived and interpreted maps capture the standards in the corporate data
base? The question of standards runs a
lot deeper than just geographic registration and encoding effort. It involves organizational and individual
perceptions, reputations and vested interests.
You'll be sorry if your implementation plan ignores these elements. Sure, they will get sorted out later-- after
you and the
A
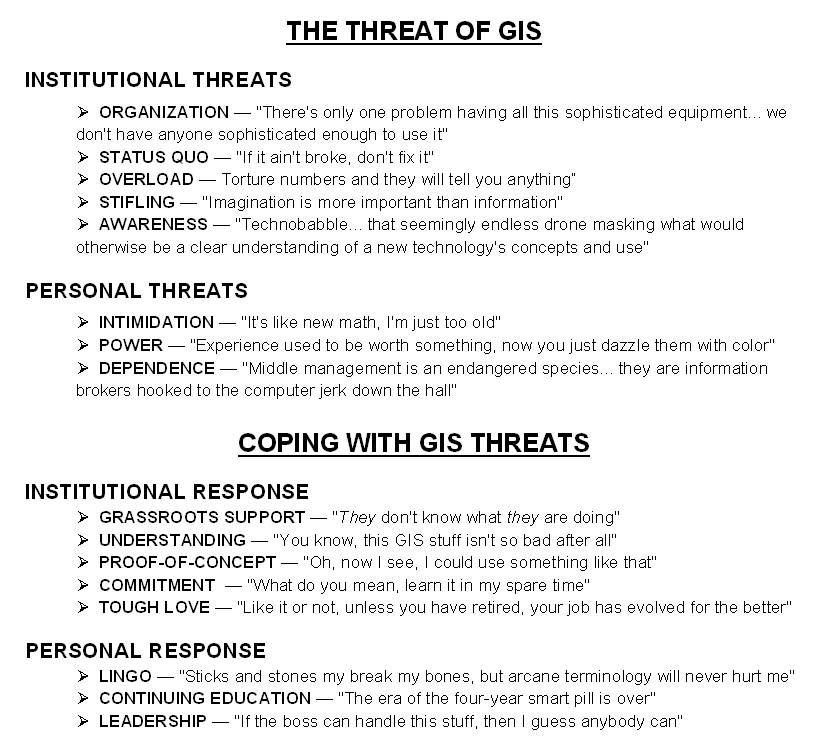
Figure 1. Institutional and
Individual Threats and responses.
Figure
1 outlines some of the threats and responses which need to be addressed. The outline is designed to stimulate
discussion in a workshop setting, but hopefully they will trip some thoughts in
your mind. As you look over the outline,
try some "free associations" with the points. Conjure up some of your own threats and
possible coping responses. It is a lot
of fun at the workshops and sparks a broader perspective on
_____________________
(Back to the Table of Contents)