|
Beyond
Mapping IV Topic 6
– Education Outside the Traditional Lines (Further Reading) |
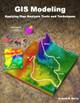
GIS Modeling book |
Lumpers
and Splitters Propel GIS — describes the two camps of
GIS (GeoExploration and GeoScience) (December 2007)
Melding
the Minds of the “-ists” and “-ologists” — elaborates
on the two basic mindsets driving the geotechnology community (July 2009)
Questioning GIS in Higher Education — describes thoughts and notes from a panel discussion on “GIS in Higher Education” (June 2012)
<Click here> for a printer-friendly version of this topic (.pdf).
(Back
to the Table of Contents)
______________________________
Lumpers and Splitters Propel GIS
(GeoWorld,
December 2007)
Earlier discussions have focused on the numerical nature of GIS data
(GeoWorld Sep-Nov, 2007; Topic 7 in the online Beyond Mapping III
compilation at http://www.innovativegis.com/basis/MapAnalysis). The discussions challenged the traditional
assumption that all data are “normally” distributed suggesting that most
spatial data are skewed and that the Median and Quartile Range
often are better descriptive statistics than the Mean and Standard
Deviation.
Such heresy was followed by an assertion that any central
tendency statistic tends to overly generalize and often conceal inherent
spatial patterns and relationships within nearly all field collected data. In most applications, Surface Modeling
techniques, such as density analysis and spatial interpolation, can be applied
to derive the spatial distribution of a set of point-sampled data.
Figure 1 outlines the major points of the earlier discussion. The left side of the figure depicts Desktop
Mapping’s approach that reduces a set of field data to a single
representative value that is assumed to be everywhere the same within each
polygon (Discrete Spatial Object). Each
parcel is “painted” with an appropriate color indicating the typical value—with
darker green indicating a slightly lower average value derived from numerous
samples falling within the polygon.
Map
Analysis’s approach, on the other hand, establishes a spatial gradient based on
the relative positions and values of the point-sampled data (Continuous Spatial
Distribution). A color ramp is used to
display the continuum of estimated values throughout each parcel—light green
(low) to red (high). Note that the
continuous representation identifies a cluster of extremely high values in the
upper center portion of the combined parcels that is concealed by the discrete
thematic mapping of the averages.
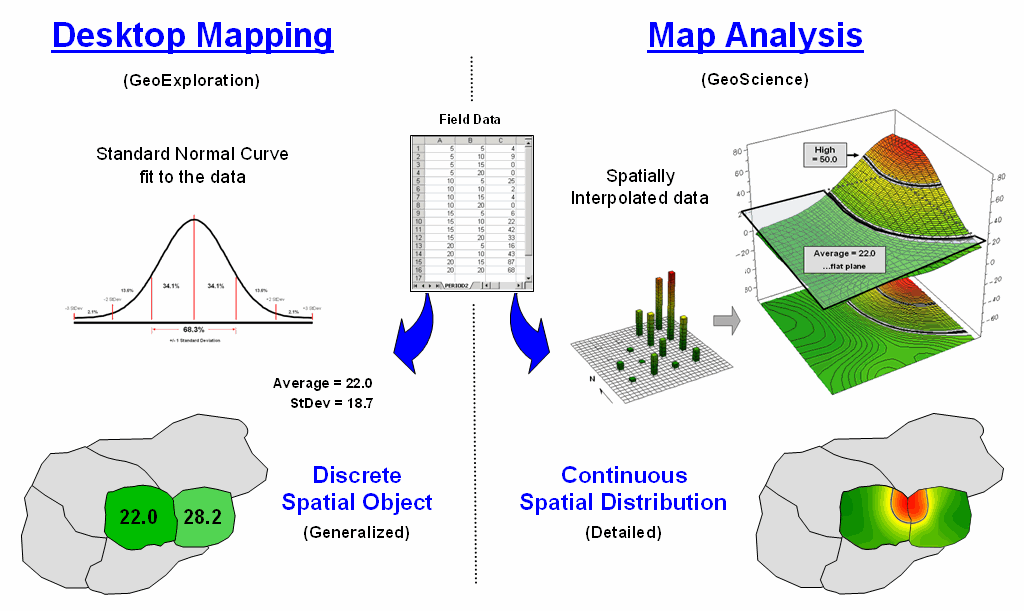
Figure 1. A data set can be characterized both
discretely and continuously to derive different perspectives of spatial
patterns and relationships.
OK, so much for review …what about the big picture? The discussion points to today’s convergent
trajectory of two GIS camps— GeoExploration and GeoScience. Traditional computer companies like Google,
Microsoft and Yahoo are entering the waters of geotechnology at the
GeoExploration shallow end. Conversely,
GIS vendors with deep keels in GeoScience are capitalizing on computer science
advances for improved performance, interoperability and visualization.
An important lesson learned by the GeoScience camp is that data has to
be integrated with a solution and not left as an afterthought for users to
cobble together. Another lesson has been
that user interfaces need to be intuitive, uncluttered and consistent across
the industry. Additionally, the abstract
2D pastel map is giving way to 3D visualization and virtual reality renderings—
a bit of influence from our CAD cousins and the video game industry.
But what are the take-aways for traditional computer science
vendors? First and foremost is an active
awareness of the breadth of geotechnology, both in terms of its technical
requirements and its business potential.
Under the current yardstick of “eyeball contacts,” GeoExploration tools
have been wildly successful.
But at the core, have recent technological advancements really changed
mapping? …or has the wave of GeoExploration tools just changed mapping’s
expression and access? …has the GIS
evolution topped (or bottomed) out?
…what about the future?
Current revolutionary steps in analytics and concepts are
underway like the energized paddling beneath a seemingly serene swan. As a broad-brush framework for discussion of
where we are heading, recall from your academic days the Philosopher’s
Progression of Understanding shown in figure 2.
It suggests that are differences between the spatial Data/Information
describing geographic phenomena and the Knowledge/Wisdom needed for
prescribing management action that solve complex spatial problems.
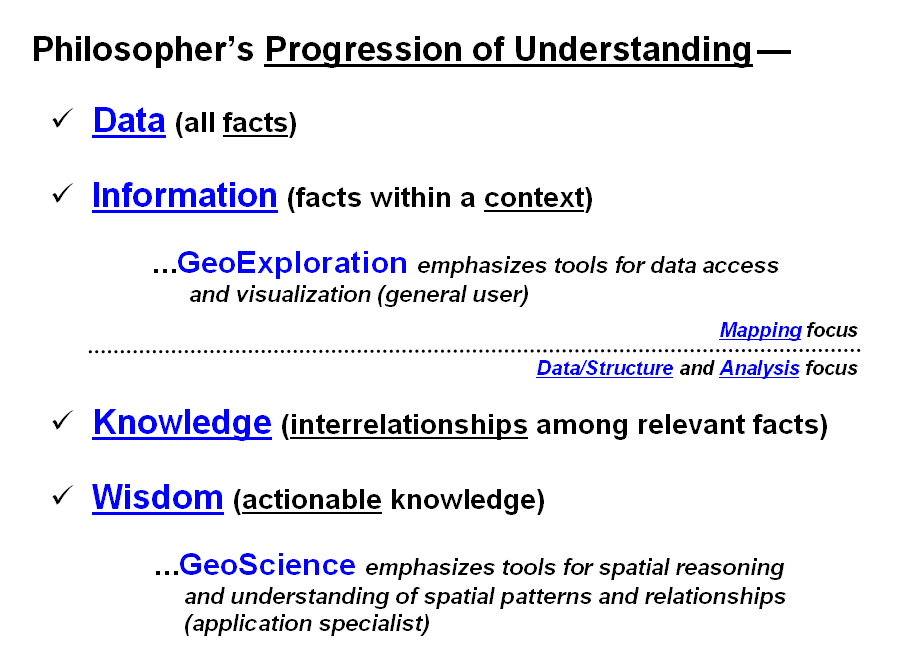
Figure 2. The two broad camps of geotechnology occupy
different portions of the philosopher’s progression of understanding.
Most GeoExploration applications simply assemble spatial data into
graphic form. While it might be a knock-your-socks-off
graphic, the distillation of the data to information is left to visceral
viewing and human interpretation and judgment (emphasizing Data and
Information).
For example, a mash-up of a set of virtual pins representing crimes in
a city can be poked into a Google Earth display. Interpretation and assessment of the general
pattern, however, is left for the brain to construe. But there is a multitude of analytics that
can be brought into play that translates the spatial data into information,
knowledge and wisdom needed for decision-making. Geo-query can segment by the type of crime;
density analysis can isolate unusually high and low pockets of crime;
coincident statistics can search for correlation with other data layers;
effective distance can determine proximity to key features; spatial data mining
can derive prediction models.
While the leap from mapping to map analysis might be well known to
those in GeoScience, it represents a bold new frontier to the GeoExploration
camp. It suggests future development of
solutions that stimulate spatial reasoning through “thinking with maps”
(Information and Knowledge) rather than just visualizing data— a significant
movement beyond mapping.
In part, the differences between the GeoExploration and GeoScience
camps parallel society’s age-old dichotomy of problem perception—lumpers and
splitters. A "lumper" takes a broad view assuming that details of a
problem are not as important as overall trends ...a picture is worth a thousand
words (holistic). A "splitter"
takes a detailed view of the interplay among problem elements ...a model links
thousands of pieces (atomistic).
So how does all this playout in
geotechnology’s future? The two camps
are symbiotic and can’t survive without each other; sort of like Ralph and
Alice Kramden in The Honeymooners.
GeoExploration fuels the fire of mass acceptance, and in large part
finances technology development through billions of mapping clicks (General
User; access and visualization).
GeoScience lubricantes the wheels of advancement by developing new data
structures, analytical tools and applications (Application Specialist; spatial
reasoning and understanding).
It’s important to note that neither camp is
stationary and that they are continually evolving as we move beyond traditional
mapping. A large portion of the mystique
and influence of application specialists just a few years ago are now
commonplace on the desks (and handheld devices) of the general public. Similarly, the flat, pastel colored maps of just
a few years ago have given away to interactive 3D displays. While there will always be the lumpers and
splitters differences in perspective, their contributions to the stone soup of
geotechnology are equally valuable—actually invaluable.
Melding the Minds of the “-ists” and
“-ologists”
(GeoWorld, July
2009)
I recently attended the GIS in Higher Education Summit for Colorado Universities
that wrestled with challenges and opportunities facing academic programs in
light of the rapid growth of the geographic information industry and its
plethora of commercial and government agency expressions. Geotechnology’s “mega-technology status”
alongside the giants of Nanotechnology and Biotechnology seems to be both a
blessing and a curse. The Summit’s
take-away for me was that, while the field is poised for exponential growth,
our current narrow footing is a bit unstable for such a giant leap.
Duane Marble in a thoughtful article (Defining the Components of the
Geospatial Workforce—Who Are We?; ArcNews, Winter 2005/2006) suggests that—
“Presently, far too many academic programs
concentrate on imparting only basic skills in the manipulation of existing GIS
software to the near exclusion of problem identification and solving; mastery
of analytic geospatial tools; and critical topics in the fields of computer
science, mathematics and statistics, and information technology.”
This dichotomy of “tools” versus “science” is reminisce of the “-ists
and -ologists” Wars of the 1990’s.
While not on the same level as the Peloponnesian War that reshaped Ancient Greece, the two
conflicts have some parallels. The
pragmatic and dogged Spartans (an oligarchy)
soundly trounced the intellectual and aristocratic Athenians (a
democracy). However in the process, the
economic toll was staggering, poverty widespread,
cultures devastated and civil war became a common occurrence throughout the
Greek world that never recovered its grandeur.
Figure 1. A civilized and gracious tension exists between the of-the-tool and
of-the-application groups.
Figure 1 portrays a similar, yet more
civilized and gracious tension noted during the Education Summit. The “-ists” in the group pragmatically
focused on programs emphasizing a GIS specialist’s command of the tools needed to
display, query and process spatial data (Data and Information focus). The “-ologists,” on the
other hand, had a broader vision of engaging users (e.g., ecologists,
sociologists, hydrologists, epidemiologists, etc.) who understand the science
behind the spatial relationships that support decision-making (Knowledge and
Wisdom focus).
My first encounter with the “-ists” and “-ologists”
conflict involved the U.S. Forest Service’s Project 615 in the early 1990’s
(615 looked like GIS on the line-printers of the day). The nearly billion dollar procurement for
geographic information technology was (and likely still is) the largest
sole-source acquisitions of computer technology outside of the military. The technical specifications were as detailed
as they were extensive and identified a comprehensive set of analytical
capabilities involving innovative and participatory decision-making
practices. The goal was a new way of
doing business in support of their “New Forestry” philosophy using ecological
processes of natural forests as a model to guide the design of managed
forests—an “-ologists” perspective justifying the huge investment and
need for an entirely new approach to maps and mapping.
However, the initial implementation of the system was primarily under
the control of forest mensurationists—an “ists” perspective emphasizing
data collection, inventory, query and display.
The result was sort of like a Ferrari idling to and from a super market
of map products.
Geotechnology’s critical and unifying component is the application
space where the rubber meets the road that demands a melding of the minds of
technology and domain experts for viable solutions. While mapped data is the foundation of a
solution, it is rarely sufficient unto itself.
Yet our paper-map legacy suggests that “map products” are the focus and
spatial databases are king—“build it and they (applications) will come.”
Making the leap demanded by mega-technology status suggests more than a
narrow stance of efficient warehousing of accurate data and easy access to
information. It suggests “spatial
reasoning” that combines an understanding of both the tool and the relevant
science within the context of an application.
Figure 2. Geotechnology applications involve series of interacting levels of
people, polices and paradigms.
Like a Russian nesting doll, spatial applications involve a series of interacting levels of people, polices
and paradigms (figure 2). Decision-makers
utilize a spatial solution derived by the “-ists and -ologists”
within the guidance of Stakeholders
(imparting value judgments), Policy Makers (codifying consensus) and the
General Public (recipients of actions).
An educated society needs to understand spatial technology commensurate
with the level of their interaction—to not do so puts Geotechnology in “black
box” status and severely undermines its potential utility and
effectiveness.
An academic analogy that comes to mind is statistics. While its inception is rooted in 15th
century mathematics, it wasn’t until early
in the 20th century that the discipline broadened its scope and societal
impact. Today it is difficult to find
disciplines on campus that do not develop a basic literacy in statistics. This level of intellectual diffusion was not
accomplished by funneling most of the student body through a series of
one-size-fits-all courses in the Statistics Department. Rather it is accomplished through a dandelion
seeding approach where statistics is enveloped into existing disciplinary
classes and/or specially tailored courses (e.g., Introduction to Statistics for
Foresters, Engineers, Agriculturists, Business, Basket Weaving, etc.).
This doesn’t mean that deep-keeled Geotechnology curricula are pushed
aside. On the contrary, like a
Statistics Department, there is a need for in-depth courses that produce the
theorists, innovators and specialists who grow the technology’s capabilities
and databases. However it does suggest a
less didactic approach in which all who touch GIS must “start at the beginning
and when you get to the end...stop” (The Cheshire Cat).
It suggests breadth over depth for many of tomorrow’s GIS “-ologists”
who might be more “of the application” than the traditional “of the tool”
persuasion— sort of like an outrigger canoe with Geotechnology as the lateral support float. Also it suggests a
heretic thought that a “disciplinary silos” approach which directly speaks to a
discipline’s applications might be the best way to broadly disseminate the
underlying concepts of spatial reasoning.
While academic silos are generally inappropriate for database design
and development (the “-ists” world), they might be the best mechanism
for introducing and fully engaging potential users (the “-ologists”
world). In large part it can be argued
that the outreach to other disciplines is our foremost academic
challenge in repositioning Geotechnology for the 21st Century.
Questioning GIS in Higher Education (GeoWorld, June 2012)
Recently I had the opportunity to sit on a panel concerned with “GIS in
Higher Education: Simultaneously Trivializing and Complicating GIS” (see author
note 1). In about an hour of interactive
discussion we only addressed a couple of the planed questions. Below are thoughts and notes from the ones we
discussed and initial thoughts on those we didn’t get to.
[Note:
during the break prior to the panel, I sketched the “technical tool” versus
“analytical tool” trajectory on the whiteboard (figure 1)]. The use of GIS as a “technical tool” has
skyrocketed, while its use as an “analytical tool” has relatively stalled over
the past decade.

Figure 1.
During the past decade GIS as a “technical tool” has skyrocketed, while
its use as an “analytical tool” has relatively stalled.
Question:
Is there an inherent responsibility for the GIS community in higher
education to further general awareness and understanding of geotechnology (RS,
GIS, GPS) across campus? If so, in what ways can we provide
opportunities for non-GIS faculty and students to learn about GIS capabilities
as a “technology tool” and as an “analysis tool” considering interdisciplinary
education constraints and considerations (e.g., budget, organization, time,
promotion/career considerations, etc.)?
In the current euphoria of GIS as a “technical tool,” the marketplace
is defining not only what GIS is, but its future. To some degree, higher education in GIS on
many campuses seems to have abdicated a primary leadership role and tend to
have taken a “vocational role” focusing on training GIS-specialists.
To most folks on campus, geotechnology is simply a set of highly useful
apps on their smart phone or a 3D fly-by anywhere in the world— in a sense trivializing
GIS. To a smaller contingent on
campus, it is career path that requires mastery of the mechanics, procedures
and buttons of extremely complex commercial software— in a sense complicating
GIS.
Any new or rapidly evolving technology has an inherent responsibility
to further general awareness of the full potential of the technology. The technical tool’s mapping, display and
navigation capabilities seem to be easily learned through vender promotion and
peer pride “look at what this can do” instruction.
However the radical nature of the “analytical tool” perspective
drastically changes how we perceive and infuse spatial information and
reasoning into science, policy formation and decision-making— in essence, how
we can “think with maps” for solving complex spatial problems. To achieve our billing as one of the three
mega-technologies of the 21st century (Bio-, Nano-
and Geotechnology) we need to 1) insure that spatial reasoning skills are
taught K12 through higher education, 2) instill the idea that modern digital
maps are “numbers first, pictures later” and 3) these organized sets of numbers
support quantitative analysis.
I am increasingly struck by the thought that we are miss-communicating
GIS’s potential, particularly with the science communities on campus who ought
to be excited about infusing spatial considerations into their research and
teaching. The result is that innovation
and creativity in spatial problem solving are being held hostage to 1) a
trivial mindset of maps as pictures, 2) an unsettling feeling that GIS software
is too complex, and 3) a persistent legacy of a non-spatial mathematics that
presupposes spatial data can be collapsed to a single central-tendency value
that ignores any spatial variability inherent in the data.
The most critical step in providing opportunities that further general
awareness and understanding across campus is to recognize the inherent
responsibility of non-GIS student education, as well as traditional GIS
specialists. Specific actions might
include—
- Encourage seminars
demonstrating applications,
- Establish a networking
organization encompassing all interested disciplines,
- Teach a class or lab for a
department outside of your own,
- Organize or team-teach a
discipline-oriented workshop with a domain expert,
- Write proposals for non-GIS
teaching, research and outreach,
- Solicit VP-level
administers’ support for integrated efforts, and
- Consider adopting a SpatialSTEM
approach that translates grid-based map analysis operations into a
mathematical/statistical framework that serves as the communal language of
science, technology, engineering and mathematics disciplines (see author note
2).
OK, that’s my Pollyanna perspective …what’s the chance that an enlarged
view of GIS education will ever take root on your campus? …what would it take?
Question: What
are the similarities and differences between GIS and non-GIS students
(e.g., background, interests, time, career aspirations) and what similarities
and differences are there in structuring course content and “hands-on”
experiences (e.g., formal class, workshops, seminars)?
My experience is that non-GIS students are less interested in the
mechanics of GIS and more interested in how GIS might be applied in their field
to solve problems. For the past few
years I have had considerable proportions of students outside of Geography/GIS
in my graduate course in GIS Modeling at the University of Denver (see author
note 3) with more outside students than inside this past term, as well as two
qualified undergrads. These students
know little about traditional GIS concepts (geodes, coordinates, projections,
data structures, cartography, etc.) but in most cases a lot about quantitative
methods for analyzing data.
I use an easy-to-learn grid-based software package (MapCalc Learner,
see author note 4) in the course that students load onto their personal
computers along with the databases used in the weekly homework
assignments. The 3-hour class meeting is
consumed with lecture and discussion (no formal lab sessions). The students work in 2-3 person teams on
their own and are expected to complete the homework assignment as a
professional report (format, spelling, grammar, composition are graded) with
discussion and appropriate screen grabs of their results—more problem-solving
than lab exercise.
I believe several “characteristics” of non-GIS students can be
identified—
- Interested in applying GIS
to solve problems in their field,
- Rarely to mildly interested
in becoming GIS-specialists,
- Want to know the basic concepts,
procedures, considerations and limitations of the technology,
- Focused on the utility of
GIS to them (minimally interested in RS or GPS),
- Concerned about the
practical aspects of GIS (e.g., software, data availability)
, and
- Generally interested in the
future directions of GIS.
I believe some fundamental “characteristics” in structuring an
educational offering for non-GIS students (course, short course, workshop,
guest lecture/lab or seminar) to consider are—
- Tailoring the presentation
to the audience’s interests, disciplinary background and current spatial
problems is critical (GIS for GIS sake is unacceptable),
- Instructor “hands-on
demonstrations” (or student hands-on exercises) are extremely valuable,
- Animated slides that
sequence logical steps in developing a concept is preferable,
- Ample time/opportunity for
discussion is important (Socratic questions as lead-in to topics are
effective), and
- Links to online further
readings/references are useful.
OK, that’s my scar-tissue-based advice …what has been your
experience(s) in presenting GIS to non-GIS folks? …what words of advice can you share?
Question: Given
the advance and convergence of Citizen Science/Volunteered Geographic
Information, mobile and easy-to-use geo-technologies, the open data movement,
and cloud-based GIS, is everyone a geographer? Is everyone able
to easily ramp into a GIS career?
- GIS as an interactive
“technical tool” for map viewing, navigation and geo-query is for everyone
(potentially billions of users; negligible skills required),
- Map making today primarily
involves choosing a template and following a wizard’s guidance from the cloud
so just about anyone can be a map maker (millions; minimal skills),
- GIS as an “analytical tool”
is for many individuals as they augment their domain expertise with spatial
reasoning and problem-solving skills (millions; considerable skills), and
- GIS as a career is not for
everyone (hundreds of thousands; considerable skills).
Question: How
will cloud computing and interactive applications impact GIS education
both from a GIS-specialist and a GIS-user perspective?
- For the GIS specialist they
need a working knowledge of structuring online databases and interactive
services/solutions in the cloud, and
- For the GIS user they will
be free from flagship software demands and will be able to utilize very large
data sets and services from the get-go, and
- Lat/Lon grid-based
referencing will become a universal key for joining currently disparate data
sets in the cloud.
Question: What
does the GIS education community need to do in the next 1 to 3 years to
ensure that spatial analysis, geographic inquiry, and GIS are supported,
taught, and used throughout the educational system?
- Teach the teachers,
- Help construct tailored
introductory lectures/labs for existing courses in other disciplines, and
- Develop/promote/offer
courses for non-GIS students (ideally team-teach with domain expert).
Question: What
types and levels of computer knowledge/expertise and quantitative methods
will be required for developing successful GIS applications and solutions?
- We need to develop in our
GIS students a better understanding of grid-based spatial stat/math operations
and quantitative analysis methods,
- Instill skills in
general-purpose, high-level programming languages, such as Python, for
integrating systems and programs with GIS, and
- Instill skills that are needed for the production and
maintenance of websites (web design and digital media studies).
Question: What
factors are most limiting to the continued development of GIS education
on your campus (student interest, colleague backing, workload, promotion/tenure
process, administration support, space, budget, etc.)?
- Promotion and tenure
doesn’t fully recognize interdisciplinary efforts,
- Budgets for
interdisciplinary courses and teaching are not readily available on most
campuses, and
- Departmental workload does
not provide time for efforts outside of the department.
The bottom line is that the GIS academic community has an intellectual
and noble responsibility to educate non-GIS students in the full capabilities
of geotechnology and how it is changing our paradigm of what maps are and how
they can be used from a historical perspective of “Where is What” to a modern
expression of “Why, So What and What If” within problem solving contexts. The rub is that there is minimal incentive,
encouragement or support in turning the academic tanker— at this point a few
charitable GIS’ing zealot professors are needed.
_____________________________
Author’s
Notes: 1) GIS in Higher Education Symposium, Metro
State College, Department of Geography, Denver, Colorado; April 6, 2012. 2) See www.innovativegis.com/basis/Papers/Other/SpatialSTEM/SpatialSTEM_case.pdf. 3) You can review all of the GIS Modeling
course materials to include lecture PowerPoints, exercises, exams and MapCalc
Learner software used at www.innovativegis.com/basis/Courses/GMcourse12/.
4) For more information on freely distributed MapCalc Learner, see www.innovativegis.com/basis/,
select Software items.
(Back to the Table of Contents)