|
Epilog –
Continuing Promise of GIS Modeling |
GIS
Modeling book |
The
Good, the Bad and the Ugly Sides of GIS — discusses
the potential of geotechnology to hinder (or even thwart) societal progress
Where
Do We Go from Here? — Swan Song after 25 years of
Beyond Mapping columns
<Click here>
for a printer-friendly version of this
topic (.pdf).
(Back to the Table of Contents)
______________________________
The Good, the
Bad and the Ugly Sides of GIS
(GeoWorld, November 2013)
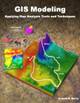
Sometimes GIS-perts imagine geotechnology as a super hero (“GIS Techymon,” see figure 1) who can do anything— process data faster
than a gigahertz processor, more powerful than a super computer, able to leap
mounds of mapped data in a single bound and bend hundreds of polylines with a single click-and-drag—all for truth, justice and all
that stuff. With the Spatial Triad for
super powers (RS, GIS, GPS), the legacy of manual mapping has been all but
vanquished and millions upon millions of new users (both human and robotic)
rely on GIS Techymon to fill their heads and circuit
boards with valuable insight into “where is what, why, so what and what if”
expressions of spatial patterns and relationships.
In just few decades, vast
amounts of spatial data have been collected and corralled, enabling near
instantaneous access to remote sensing images, GPS navigation, interactive
maps, asset management records and geo-queries as a widely-used “technological”
tool. To the Gen X generation,
technology is a mainstay of their lives—geotechnology is simply another highly
useful expression.
A
similar but much quieter GIS revolution as an “analytical” tool (see Author’s
Notes 1) has radically changed how foresters, farmers, and city planners
manage their lands; how retail marketers, political forecasters and
epidemiologists “see” spatial relationships in their data sets; how policemen,
generals and political pundits develop tactics for engaging the opposition;
plus thousands of other new paradigms and practices. This growing wealth of sophisticated spatial
models and solutions did not exist a couple of decades
ago, but now they have become indispensible and commonplace parts of
contemporary culture. All is good …or is
it?
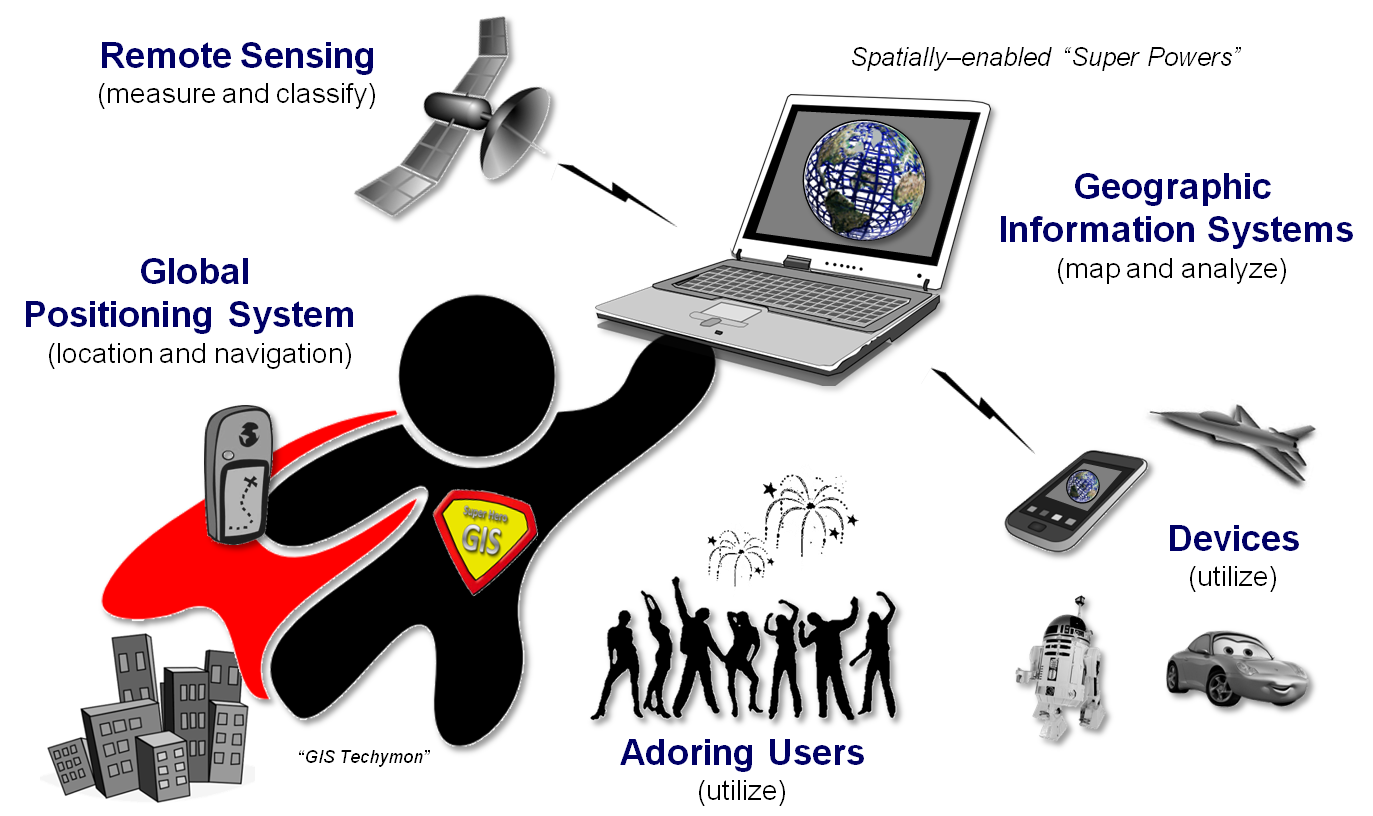
Figure 1. Look up in the data cloud, it’s
GIS Techymon to save the day…all is good (or is it?).
Some
fail to see virtue in all things GIS and actually see the “law of unintended
consequences” at play to expose a darker-side of geotechnology. Even the best of intentions and ideas can turn
bad through unanticipated effects.
High
resolution satellite imagery, for example, can be used to recognize patterns,
map land cover classes and assess vegetation biomass/vigor throughout the
globe—the greater the spatial detail of the imagery the better the
classifications. But in the early 2000s
when the satellite resolution was detailed enough to discern rooftop sun
bathers in London the Internet lit up.
It seems zooming in on an Acacia tree is good but zooming in on people
is bad—an appalling violation of privacy.
Fast
forward to today with drone aircraft tracking people as readily as it tracks an
advancing wildfire. Or consider the
thousands of in-place and mobile cameras with sophisticated facial recognition
software that shadow private citizens in addition to criminals and
terrorists. Or the concern for data
mining of your credit card swipes, demographic character and life style profile
in both space and time to better market to your needs (good) but at what cost
to your privacy (bad).
Or just
last week in my hometown, a suspect parking database was discovered that has
captured license plates “on-the-fly” for years and can be searched to identify
the whereabouts of any vehicle. The
system is good at catching habitual parking offenders and possibly a bad guy or
two, but to many the technology is seen as a wholesale assault on the privacy
of the ordinary good guy.
The
Rorschach ink blot nature of most technology that flips between good and bad
has been debated for decades. Several
years ago I had the privilege of hosting a Denver University event exploring “Geoslavery or Cyber-Liberation: Freedom and Privacy in the
Information Age” (see Author’s Note 2).
While the panel of experts made excellent points and provided
stimulating discussion, an acceptable balance that encourages geotechnology’s
good side while constraining its bad side was not struck. The Jekyll
and Hyde personality of geotechnology still persists, however it has been
magnified many fold due to its ever-expanding tentacles reaching further and
further into general society.
The
collateral damage of unintended consequences seems to tarnish GIS Techymon’s image as a classic super hero. However the purposeful perverse
application of geotechnology is really ugly.
Mark Monmonier’s classic book “How to Lie with Maps” (1996, University Of Chicago Press) reveals how maps can be (and often
must be) distorted to create a readable and understandable map. These cartographic white lies pale in
comparison to the deliberate misrepresentation or misuse of mapped data to
support biased propaganda or hidden agendas.
For
example, the top inset in figure 2 depicts a hypothetical map that rearranges
state borders to equally distribute the population of the United States so each of the
imagined states has1/50th of the total population or about 6 million
people (see Author’s Note 3). This
cartogram is far from an ugly distortion of fact as it effectively conveys
population information in a diagrammatic form that stimulates thought.
The
bottom inset addresses the spatial distribution of population as well. However, in this case it involves deliberate manipulation of polygon boundaries for
partisan political advantage by combining census and party
affiliation data to “gerrymander” congressional districts (see Author’s
Note 4).
The drafting
of spindly tentacles and ameba-like pseudopods concentrate the voting power of
one party into as many safe districts as possible and dilute opposition votes
as much as possible. In the opinion of
many political pundits, the GIS-gerrymandered districts are the root-cause of
much of the current bifurcated, dysfunctional and down-right hostile congressional
environment we face.
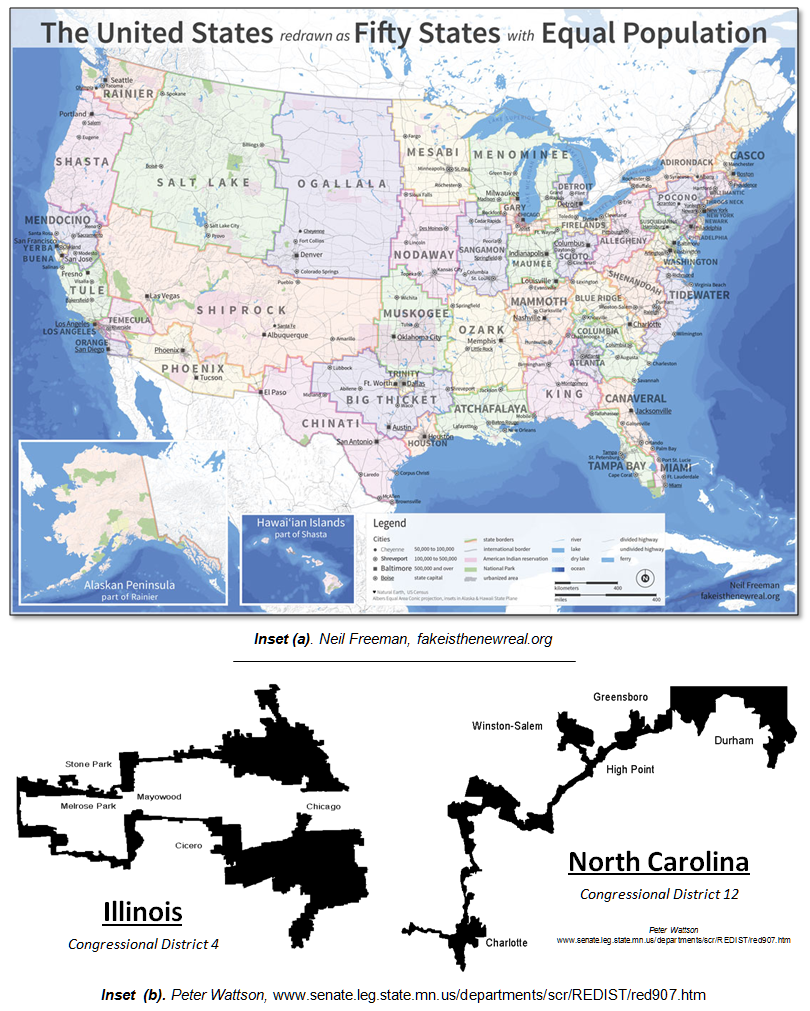
Figure 2. Inset (a) shows a redrawing of the 50 states
forcing equal populations; inset (b) shows examples of deliberate manipulation of political
boundaries for electoral advantage.
Map
analysis is very effective in addressing the gerrymandered spatial optimization
problem, regardless of any adverse moral and political ramifications. It also is good at efficiently keeping less
technologically endowed peoples at bay, tracking children and the elderly for
their own safety, monitoring the movements of parolees and pedophiles,
fueling
information warfare and killing people, and hundreds of other uses that
straddle the moral fence.
GIS
is most certainly an agent of good …most of the time. But it is imperative to remember that GIS isn’t always
good, or always bad, or always ugly. The
technological and analytical capabilities themselves are ethically inert. It is how they are applied within a social
conscience context that determines which side of GIS surfaces (see Author’s
Note 5).
_____________________________
Author’s Notes: 1) See “Simultaneously Trivializing and Complicating GIS”
in the Beyond Mapping Compilation Series at http://www.innovativegis.com/basis/MapAnalysis/Topic30/Topic30.htm 2) see http://www.innovativegis.com/basis/Present/BridgesGeoslavery/
for panel discussion summary. 3) See “Electoral College
Reform (fifty states with equal population)” at http://fakeisthenewreal.org/reform/. 4)
See Beyond Mapping column on “Narrowing-in on Absurd Gerrymanders” in the Beyond
Mapping Compilation Series at http://www.innovativegis.com/basis/MapAnalysis/Topic25/Topic25.htm
. 5) See “Ethics and GIS: The
Practitioner’s Dilemma” at http://www.spatial.maine.edu/~onsrud/GSDIArchive/gis_ethics.pdf.
Where Do
We Go from Here?
(GeoWorld, December 2013)
I have been involved in
GIS for over four decades and can attest that it has matured a lot over that
evolutionary/revolutionary period. In the
25 years of the Beyond Mapping column, I have attempted to track a good deal of
the conceptual, organizational, procedural, and sometimes disputable
issues.
In the 1970s the foundations
and fundamental principles for digital maps took the form of “automated
cartography” designed to replace manual drafting with the cold steel of a pen
plotter. In the 1980s we linked
these newfangled digital maps to traditional data base systems to create
“spatial database management systems” that enabled users to easily search for
locations with specific conditions/characteristics, and then display the
results in map form.
The 1990s saw an
exponential rise in the use of geotechnology as Remote Sensing (RS) and the
Global Positioning System (GPS) became fully integrated with GIS— so integrated
that GIS World became GeoWorld to reflect the ever expanding
community of users and uses. In
addition, map analysis and modeling spawned a host of new applications, as well
as sparking the promise of a dramatic shift in the historical perspective of
“what a map is (and isn’t).”
The 2000s saw the
Internet move maps and mapping from a “down the hall and to the right”
specialist’s domain, to everyone’s desktop, notebook and mobile device. In today’s high tech environment one can
fly-through a virtual reality rendering of geographic space that was purely
science fiction a few decades ago.
Wow!
My ride through GIS’s
evolution has been somewhat akin to Douglas Adams’ Hitchhiker’s Guide to the
Galaxy Series. Writing a monthly
column on geotechnology finds resonance in his description of flying— “There is
an art, it says, or rather, a knack to flying. The knack lies in learning how
to throw yourself at the ground and miss.”
As GIS evolved, the twists and turns around each corner were far from
obvious, as the emerging field was buffeted in the combined whirlwinds of
technological advances and societal awakening.
In most cases,
geotechnology’s evolution since its early decades has resulted from outside
forces: 1) reflecting macro-changes in computer science, electrical engineering
and general technological advances, and 2) translating workflows and processes
into specialized applications. The
results have been a readily accessible storehouse of digital maps and a wide
array of extremely useful and wildly popular applications. Geotechnology’s “where is what” data-centric
focus has most certainly moved the masses, but has it moved us closer to a
“why, so what, and what if” focus that translates mapped data into spatial
information and understanding?
Figure 1. The idea of map variables being map-ematically
evaluated has been around for decades but is still not fully embraced. (I wonder what other nutty ideas are
languishing in the backwaters of geotechnology that have yet to take form).
While the technological
expression of GIS has skyrocketed, the analytical revolution that was promised
still seems grounded. I have long
awaited a Big Kahuna wave of map analysis and
modeling (figure 1) to sweep us well beyond mapping toward an entirely new
paradigm of maps, mapping and mapped data for understanding and directly
infusing spatial patterns and relationships into science and
problem-solving.
In the 1970s and 80s my
thoughts turned to a “map-ematical” framework for the
quantitative analysis of mapped data (see Author’s Notes 1 and 2). The suggestion that these data exhibited a
“spatial distribution” that was quantitatively analogous to a “numerical
distribution” was not well received. The
further suggestion that traditional mathematical and statistical operations
could be spatially evaluated was resoundingly debunked as “disgusting” by the
mapping community and “heresy” by the math/stat community.
In the early years of GIS
development, most people “knew” what a map was (an organized collection of
point, line and polygon spatial objects) and its purpose (display, navigation,
and geo-query). To suggest that
grid-based maps formed continuous surfaces defining map variables that could be
map-ematically processed was brash.
Couple that perspective with the rapidly advancing “technological tool”
expressions, and the “analytical tool” capabilities were relegated to the back
of the bus.
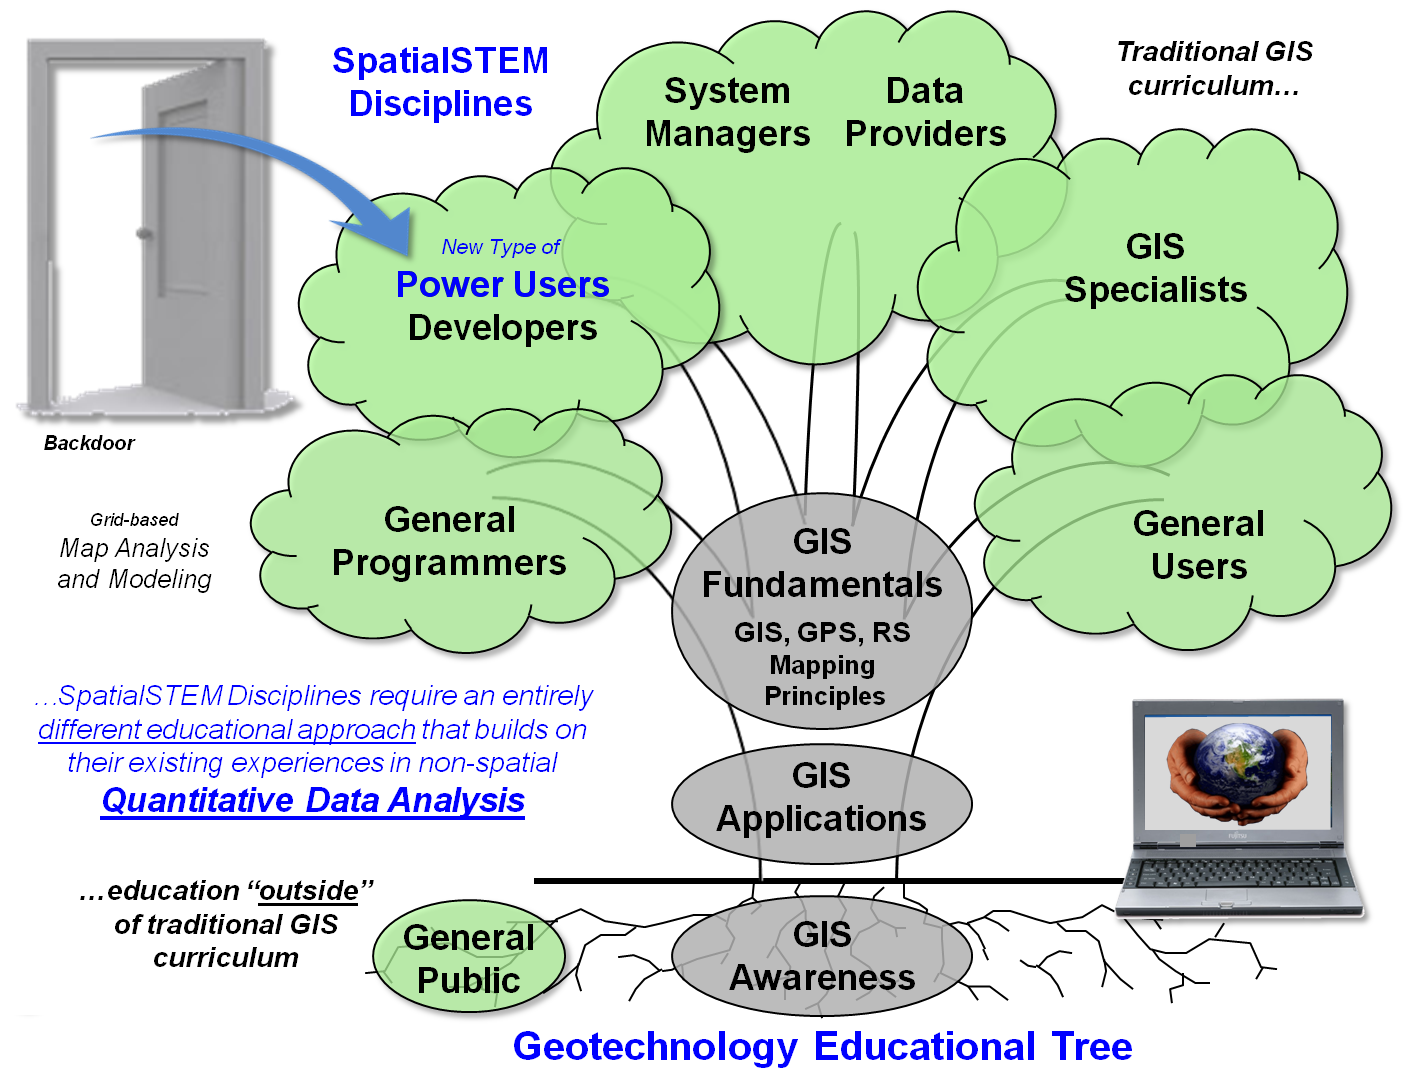
Figure 2. Traditional GIS education does not adequately
address STEM disciplines’ focus on quantitative analysis of mapped data.
Fast-forward to today and
sense the changes in the wind and sea of thought. Two central conditions are nudging the GIS
oil tanker toward grid-based map analysis and modeling: 1) the user community
is asking “is that all there is” to GIS? (like Peggy Lee’s classic song but about mapping,
display, geoquery and navigation), and 2) a building interest in spatialSTEM
that is prodding the math/stat community to no longer ignore spatial patterns
and relationships— increasing recognition that “spatial relationships exist and
are quantifiable,” and that “quantitative analysis of maps is a reality.”
Education will be the
catalyst for the next step in geotechnology’s evolution toward map analysis and
modeling. However, traditional GIS
curricula and programs of study (Educational Tree in figure 2) are ill-equipped
for the task. Most STEM students are not
interested in becoming GIS-perts; rather, they want
to employ spatial analysis tools into their scientific explorations—a backdoor
entry as a “Power User.” What we (GIS
communities) need to do is engage the STEM disciplines on their
turf—quantitative data analysis—instead of continually dwelling on the
technical wonders of modern mapping, Internet access, real-time navigation,
awesome displays and elegant underlying theory.
These wonders are tremendously
important and commercially viable aspects of geotechnology, but do not go to
the core of the STEM disciplines (see Author’s Notes 3 and 4). Capturing the attention of these folks
requires less emphasis on vector-based approaches involving collections of
“discrete map features” for geoquery of existing map data, and more emphasis on
grid-based approaches involving surface gradients of “continuous map variables”
for investigating relationships and patterns within and among map layers. AKAW!! … surfers
cry when they spot a “hugangus” perfect wave.
However, after 25 years
of shuffling along the GIS path, I have reached my last Beyond Mapping column
in GeoWorld …the flickering torch is ready to be passed to the next generation
of GIS enthusiasts. For those looking
for an instant replay of any of the nearly 300 columns, you can access any and
all of them through the four online/hardcopy books in the Beyond Mapping
Compilation Series or Chronological Listing posted at—
http://www.innovativegis.com/basis/BeyondMappingSeries/
_____________________________
Author’s Notes: 1) See “An
Academic Approach to Cartographic Modeling in Management of Natural Resources,”
1979 and 2) “A Mathematical Structure
for Analyzing Maps,” 1986 …both historical papers posted at www.innovativegis.com/basis/Papers/Online_Papers.htm. 3) See “Topic 30, A Math/Stat Framework for Map Analysis” in the Beyond Mapping Compilation
Series posted at www.innovativegis.com/basis/MapAnalysis/. 4) see “Closing Panel on Geospatial STEM” remarks
about SpatialSTEM education made at the Geospatial Conference of the West,
posted at http://www.innovativegis.com/basis/Present/GeCo_West2013/Panel/GeospatialSTEM_panel.pdf.