|
GeoWorld Articles Mapping a Firewall: Modeling and
Visualizations Assess Wildfire Threats, Risks and Economic Exposure |
Further Understanding
Spatial Patterns and Relationships
( |
Feature article for GeoWorld,
October 2009, Vol. 22, No. 10, pgs. 20-23
<Click here>
for a printer-friendly version of this paper (.pdf).
|
|
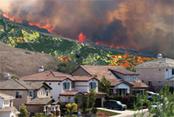
In
the 2007 fire season, San Diego County alone saw 360,000 acres burned, more
than $1 billion in losses, more than 1,200 homes destroyed, many buildings and
critical infrastructure lost, and significant amounts of commodity agriculture
ruined. Suppression costs at the federal level have surpassed $1 billion
annually for the last several years, and state and local costs are believed to
be more than double that.
The
consequences of wildfires have never been greater as more people move into
wildfire-prone areas. And there’s an increasing need for fuel treatments,
mitigation planning, prevention awareness and recovery preparedness to reduce
wildfire risk and impacts to these communities.
But
where is the greatest risk? What are the potential economic, social and
environmental impacts? What and where are mitigation actions most needed? How
can alternatives be quantified, compared and prioritized? Are we spending our
budgets effectively and efficiently?
This
article focuses on the utility of geotechnology, map-analysis procedures, and
Web-based visualization and delivery options to identify areas of greatest
jeopardy as well as quantify the dollar impact of wildfire loss and proposed
mitigation efforts.
Wildfire
Threat and Risk Modeling
Previous
wildfire risk models developed a relative scale, such as the low, medium, high
and extreme fire-danger levels seen at the entrances of national forests.
Although this scale is useful for informing the public and guiding broad fire
planning, it doesn’t fully express wildfire risk. Comprehensive risk modeling
involves three distinct elements:
1) Wildfire Threat—estimating the probability
and intensity of a wildfire occurring at a location.
2) Wildfire Effects—quantifying the impact of
the potential loss.
3) Wildfire Risk—combining the threat and
effects into a measure of probable loss over time.
The
Wildfire Threat portion integrates numerous mapped data layers such as weather
factors, historical fire occurrence, surface and canopy fuels, terrain, and
suppression effectiveness based on historic fire protection (see Figure 1). A
previous GeoWorld article (Quantifying Wildfire Risk, December 2005)
described the fundamental approach and data layers involved in spatially
modeling wildfire threat.
Note
that Wildfire Effects is subject to change based on the characteristics and
priorities of the specific geographic area. As such, Figure 1 only provides an
example of common fire-effects inputs. The current enhanced model had input
from an actuarial statistician and a risk-modeling expert with considerable
experience in risk mapping for the insurance industry. The modifications
incorporated advanced techniques, such as dynamic elliptical windows for
calculating wildfire probability based on fire-behavior parameters, adjustments
for urban-area partial windows and refinements for handling non-burnable areas.
This
expanded perspective fully integrates remote sensing, current fire-science
research, actuarial statistics and GIS expertise. The solution involves vector
and raster data layers and processing procedures as well as integration with
the standard LANDFIRE Program datasets. As a result, the output maps are useful
to a broader group of users, ranging from traditional wildfire professionals to
county land-use planners, insurance industry agents and all levels of
government decision makers.
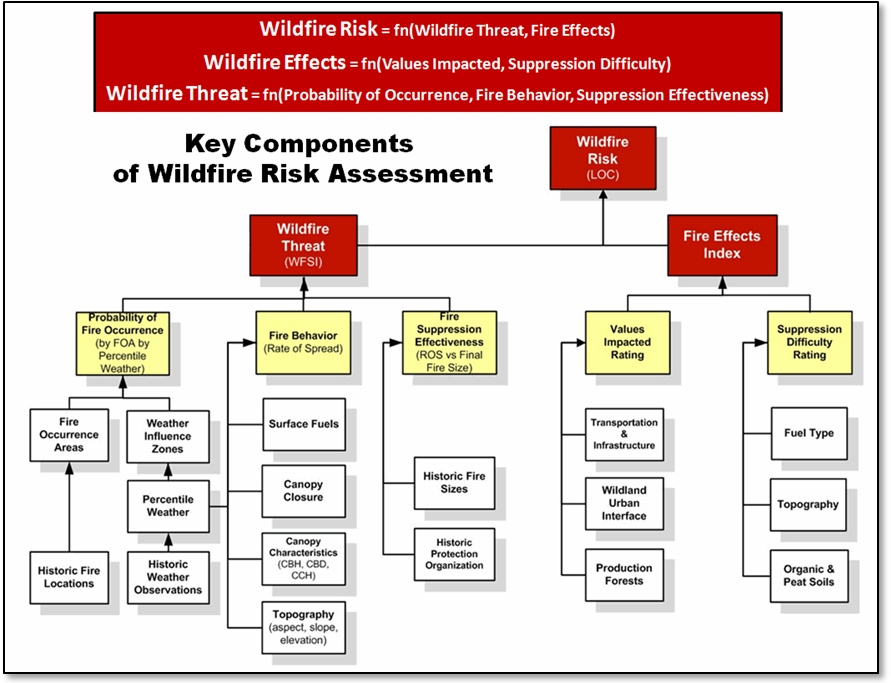
Figure
1.
A flowchart depicts the key components of Sanborn’s Wildland Fire Risk
Assessment System.
Visualizing
Wildfire Risk Outputs
Traditionally,
GIS has been used to display the outputs of models, such as wildfire risk,
using desktop software applications. Recent advancements have led to the
delivery of thematic maps using Web-mapping interfaces on the Internet
(although there are few examples for wildfires).
With
the advent of 3-D globes and related public Web-mapping capabilities (e.g.,
Google Earth, Microsoft’s Virtual Earth (Bing! Maps) and ArcGIS Online), the
public and professionals now have an expectation of Web-mapping capabilities
and availability. This explosion in Web mapping with multi-resolution imagery
backdrops has made the consumer “spatially aware” and set the baseline for
delivering Web-mapping products.
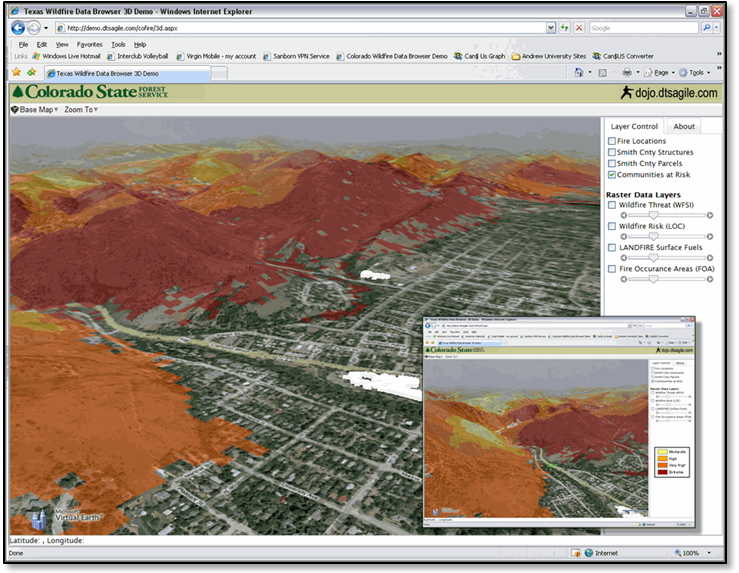
Figure
2.
A Virtual Earth visualization of Wildfire Threat maps provides
interactive access and processing for a variety of fire professionals, land
planners and the general public.
Figure
2 shows an example of a wildfire threat map superimposed on the terrain for
Boulder, Colo., using public Web-mapping capabilities in Microsoft’s Virtual
Earth map interface. Capabilities exist to integrate thematic risk maps with
the underlying imagery-based map interface, including enhancements that show
real-time weather information, such as cloud cover or NEXRAD data.
Figure
3 shows wildfire risk outputs from the Southern Wildfire Risk Assessment
superimposed over the perimeter of the recent Highway 31 Fire in South
Carolina. The prototype uses ESRI’s Silverlight interface for ArcGIS Server
combined with ArcGIS Online imagery services. The integration of active or
real-time data provides greater context for using wildfire risk assessment
data, providing tactical utility in addition to conventional planning uses.
The
maps can be served via the Internet and accessed by a variety of users: the
general public, county planners, and emergency-response and wildfire
professionals. By varying the transparency of the wildfire risk output layers,
the relative visual prominence of the underlying land cover and features can be
adjusted.
This
easily accessed format facilitates a user’s ability to “fly through” the
wildfire threat information, zoom in to an area of interest and assess the
relative patterns within a context of its surrounding conditions and features.
The threat values can be expressed as traditional wildfire danger ratings (low,
moderate, high) or as the discrete probability of a wildfire occurring.
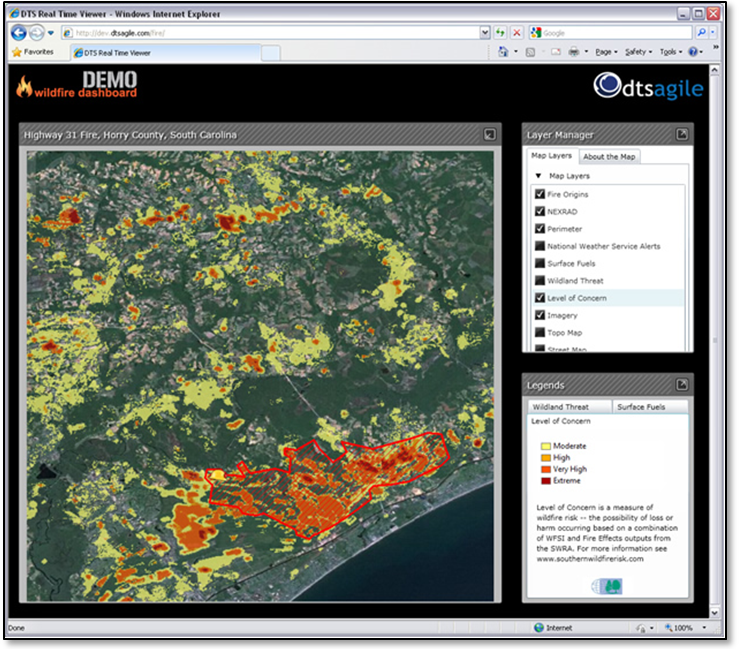
Figure
3. Integrating risk-assessment results
with real-time data, such as fire perimeters, NEXRAD and NWS Alerts, provides
greater utility for planners and responders.
Web-based
access is critical to widespread use by professionals and the public with
minimal GIS experience. Interactive mapping, with the ability to onscreen
digitize or enter ZIP Codes to tailor results to specific areas of interest, is
an important extension. The ability to easily generate summary reports and maps
via the Web is central to using the data for planning purposes.
Extending
Risk to Probable Impacts
The
impacts and consequences of wildfire (or any catastrophic event) can be
characterized as the following:
• Economic—loss
of structures and property, damage to critical facilities and infrastructure,
destruction of commercial forestland and agriculture cropland, etc.
• Social—damage
to sensitive cultural archeological areas, disruption of employment, demographic
displacement, loss of life, etc.
• Environmental—threatened
and endangered species, sensitive wildlife and vegetation habitats, water
sources, etc.
This
article presents examples focused only on the economic consequences of wildfire
by calculating “dollar exposure” based on the economic value of parcels. A
full-featured model describes the social and environmental consequences, and
prioritizing or weighting such consequences is a political and planning issue.
The
model mimics the FEMA HAZUS software approach for calculating “dollar exposure”
for earthquakes, hurricanes and floods. HAZUS is a risk-assessment tool used by
government agencies (especially local governments) to analyze potential risk
and perform loss estimation in support of mitigation and emergency-response
planning.
Assessing
Exposure and Damage
With
wildfire risk data now becoming readily available in fire-prone areas,
opportunities exist to use these data in concert with economic data to quantify
potential impacts and losses. The extended wildfire risk model quantifies the
economic impact of wildfire threat based on census or assessor data.
Assessor
data provide the most detailed data on the value of ownership parcels in an
area of interest and can be quantified in terms of “assessed” or “rebuild”
dollar values. When assessor and parcel data aren’t readily available, general
census data can be used to calculate dollar exposure (i.e., median housing
values).
The
left side of Figure 4 shows maps of wildfire threat probabilities and the
assessor’s rebuild values for ownership parcels within a small area of San
Diego County. The assessor’s data provide detailed and up-to-date descriptions
of the economic value for parcels and their structures.
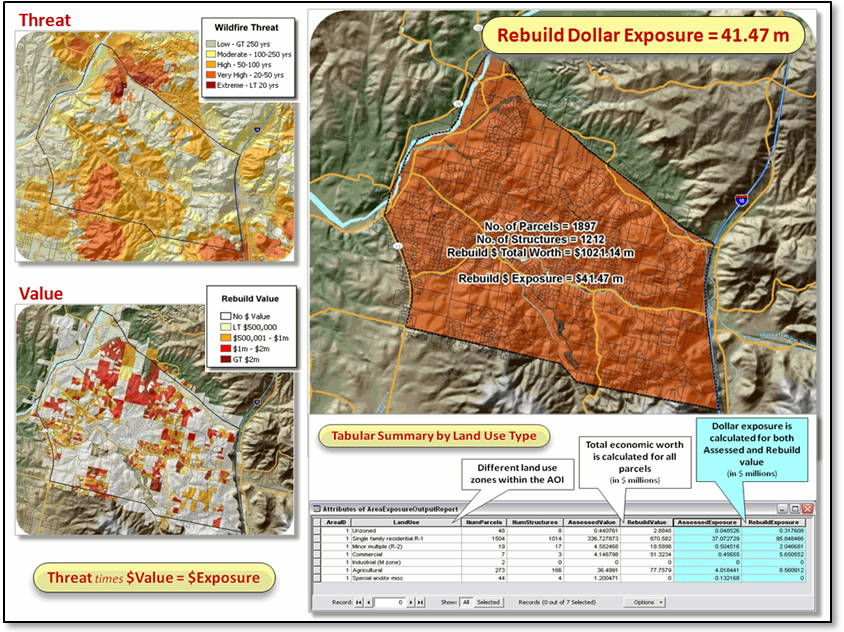
Figure
4.
Economic exposure involves multiplying the probability of a wildfire
(threat/hazard) times the value of each location (effects/consequences).
Specific
data fields used in the model include improved parcel value, land-use zone,
square footage for living space and additional square footage. The total square
footage for all structures occupying a parcel is calculated by summing the two
footage values. This total footage is multiplied by a user-defined rebuild
value per square foot to calculate a total rebuild value for each parcel in the
area.
Several
problems with assessor data complicate their use. First, there are
inconsistencies in data format and content, as each county tailors its database
to fit internal needs. Similarly, timeliness is an issue due to a lack of
standards for reporting period or established delay before making the data
generally available. And accuracy can be a problem in the exactness and
correctness of the data. This is particularly troublesome for large ownership
parcels without coordinates for the exact location of structures within their
borders.
The
logic ingrained in the wildfire risk calculations involves four major steps:
1) Identify an area of interest from existing
lists or by interactively digitizing a polygon and buffering it an appropriate
distance.
2) Calculate the aggregated wildfire threat
within the buffered area.
3) Calculate the total value of all structures
for all parcels within the area of interest.
4) Calculate the “dollar exposure” by
multiplying the aggregated threat times the total value: Dollar Exposure =
Probability (value between 0.0 and 1.0) * Value (assessed and rebuild).
The
model outputs for an area of interest include the total number of parcels,
total number of structures, total assessed value for all structures, total
rebuild value for all structures, and overall dollar exposure risk based on
assessed and rebuild value. The output is displayed as thematic maps for any of
the six output values.
To
provide additional interpretation, a summary table of values is subtotaled by
land-use zone. Each parcel is defined by its dominant land-use zone, and the
model then loops through the parcels and keeps a running total of all the
output values. Future enhancements to the model will overlay layers of critical
facilities (e.g., roads, pipelines, sewer and water lines, hydrants,
natural-gas pipelines, etc.) and report on the number of facilities to provide
a more complete estimate of potential exposure.
Calculating
ROI for Proposed Mitigation
An
extended application of wildfire risk modeling is mitigation assessment for
evaluating alternative management actions. This involves calculating the dollar
exposure before and after proposed landscape fuel treatments, such as
mechanical thinning or prescribed burning. Such treatments effect fuel
composition, structure and loading, which are designed to change the behavior
of a wildfire entering the treatment zone and thereby lessen the impact. The
model tracks the change in fuels and the subsequent reduction in flame length,
intensity and rate of spread, which translates into a change in the area’s
wildfire threat values.
As
shown in Figure 5, a return on investment (ROI) of mitigation can be calculated
by the following equation: ROI_mitigation = ($Before - $After) / $Treatment.
The smaller wildfire threat maps on the left depict the threat distribution
before (top) and after (bottom) treating an area just south of the area of
interest. In the example, the rebuild exposure was reduced $8 million—from $42
million before mitigation to $34 million after mitigation. Assuming a $100,000
treatment cost: ROI_mitigation = ($42m – $34m) / $100,000 = 80.0, which is a very
favorable ROI.
Often
large ratios are indicated, as total loss/destruction is implied for both $Before and $After assessments, and no fire-fighting intervention to moderate
loss is considered. Also, wildfire behavior is simulated for “typical” conditions
that might not reflect actual conditions. However, because assumptions for both
$Before and $After are constant, the ROI ratio is stable.
The
ROI ratio is useful in comparing alternative treatment areas and procedures.
The ability to simulate different scenarios is paramount for effective
budgeting and decision making. It’s important to note that periodic review is
needed, however, because land-cover, land-use and assessor-map variables are
temporally dynamic.
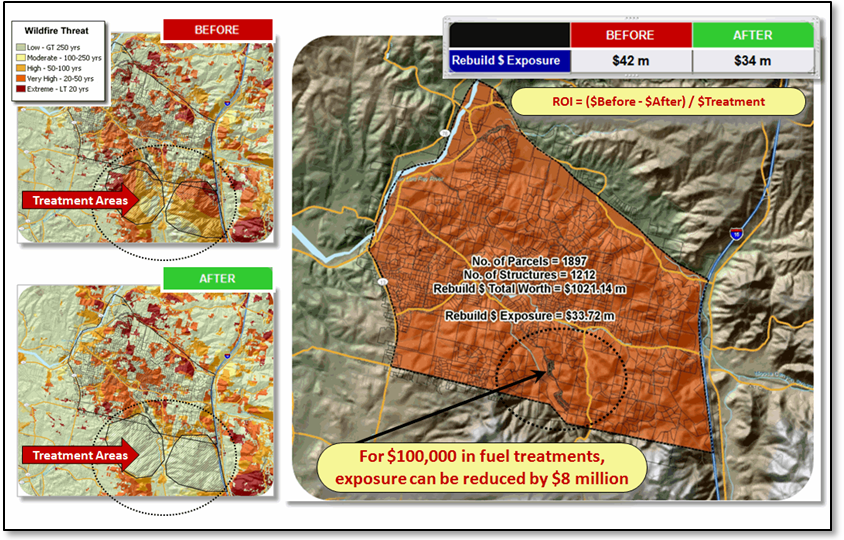
Figure
5. Rate of return of mitigation
calculates the change in dollar exposure from before and after treatments
designed to lower vegetation fuel loading.
Conclusion
Wildfire Risk Modeling has traditionally emphasized Wildfire Threat using tools developed by
fire scientists and primarily used by fire suppression professionals. More recently modeling of Wildfire Impacts (Economic, Social and
Environmental) is gaining interest, particularly by “non-traditional” parties
and stakeholders concerned with policy, planning, mitigation and recovery as
well as suppression. This article has
described two significant extensions to contemporary wildfire risk modeling— 1)
extending the relative risk scale (Low to High) to probability of fire
occurrence (0 to 1.0 probability value) and intensity of burn, and 2)
quantifying wildfire impacts and proposed mitigation efforts.
By
coupling these technical advances with an interactive, web-based mapping
environment a robust collaborative tool is provided for decision-making,
funding allocation and communication with stakeholders and general public. The combined approach places a powerful risk
assessment methodology for analyzing potential losses at the fingertips of an
enlarged group of potential users concerned with wildfire risk and impacts.
__________________
Authors’ Note: for more information about Sanborn’s Wildland Fire Risk
Assessment System, visit www.sanborn.com/solutions/fire_management.asp.
A slide set describing Wildfire Impact modeling is available at www.innovativegis.com/basis//present/GIS09_wildfire/GeoTec09_Wildfire.ppt.
David Buckley is with
Sanborn Map Company; e-mail: DBuckley@sanborn.com. Joseph K. Berry is W.M. Keck Visiting Scholar
in Geosciences, Geography, University of Denver, and Principal, Berry &
Associates // Spatial Information Systems (BASIS); e-mail: jberry@innovativegis.com. Jason Batchelor is with the County of San
Diego, Department of Planning and Land Use; e-mail: Jason.Batchelor@sdcounty.ca.gov.