Infusing
Grid-Based Map Analysis into Introductory GIS Courses
Joseph K. Berry
President, Berry &
Associates // Spatial Information Systems
Phone: 970-215-0825c
— Email: jberry@innovativegis.com
Paper presented at the 16th Annual
Conference on Geographic Information Systems,
<Click here> for
a printer friendly version (.pdf)
Abstract
Increasing popularity
of inexpensive and easy-to-use desktop mapping systems has fueled introductory
GIS course offerings in a variety of disciplines on most campuses. Textbooks and supplemental teaching materials
support basic concepts and procedures, such as data issues, thematic mapping,
geo-query and display. However, the bulk
of the introductory materials focus on vector data processing and applications
with only minimal reference to grid-based map analysis. What has been lacking is a grid-based
teaching package that seamlessly interfaces with desktop mapping systems and
teaching approaches. This paper
describes a comprehensive set of materials for instructors and students
providing hands-on exposure to the concepts, capabilities and considerations in
grid-based map analysis and modeling.
Topics include data structure, display types, vector-raster data
exchange, analytical operations and GIS modeling. Map analysis operations are divided into
logical classes based on processing similarities—reclassify, overlay, distance,
neighbors, surface modeling and statistical analysis. Numerous examples of GIS models are included
and students are encouraged to encode local data and formulate their own
models. The student CD enables work
outside of lab and contains single-seat versions of the MapCalc Learner
and Surfer Tutorial software, extensive demos, exercises and online text
materials. Instructor CDs contain a
multi-seat educational license of the software for a single computer lab and
additional materials for teaching GIS modeling at a variety of levels from
one-hour seminar through full introductory course.
MapCalc Learner – Student
Version (1 CD) with MapCalc and
Surfer tutorial systems, exercises/databases, application demos and electronic
texts; constrained to a 100x100 configuration; single seat license for
educational use only; US$21.95 plus shipping.
MapCalc Academic – Instructor
Version (2 CDs) with all of the
above plus lecture PowerPoint’s, additional exercises, one-day workshop and
full introductory course materials; unlimited analysis frame configuration;
multiple seat license (single computer lab) for educational use only; US$495.00
plus shipping.
Introduction
Courses in Geographic Information Systems (GIS) technology are proliferating on campus. What used to be the domain of geography departments has diffused into application disciplines ranging from forestry to business, engineering, law enforcement, public health and a multitude of other departments. A major factor fueling the expansion is inexpensive and user-friendly desktop mapping software.
These vector-based systems are ideal for learning the fundamentals of mapping and spatial database management. The educational experience with desktop mapping provides an excellent entry into GIS and hands-on experience in applying the basic concepts. An increasing number of resources tailored to specific application areas are available. The datasets and structured exercises provide meaningful learning experiences for a wide range of students.
Basic thematic mapping and geo-query, however, only address a portion of GIS capabilities. Grid-based map analysis hasn’t received the same attention in most academic programs. This condition often is attributed to less familiar analysis techniques that are outside manual mapping experiences and, until recently, involved complex software running on expensive hardware platforms and requiring specialized programming knowledge. The result is that exposure to grid-based analysis rarely occurred in introductory courses. This paper describes an inexpensive educational software package and supporting materials for students/instructors and discusses instructional considerations in infusing grid-based map analysis into introductory GIS courses.
Grid-Based Analysis Frame
Vector-based systems identify three basic map features that comprise all maps—points, lines and polygons. These features are suitable for characterizing discrete spatial objects, such as light poles, streets and property boundaries. However, continuous gradients, such as an elevation surface or a proximity map are poorly represented as contour lines that generalize detailed data into a set of intervals used for display.
The introduction of a grid-analysis frame provides a framework for storage and processing of a fourth basic map feature—a surface—as well as supporting a host of new analysis operations by treating geographic space as a iniformally sampled continuum. Its base spatial unit is a “cell” defined by the column and row coordinates of an imaginary grid superimposed over an area. The grid cell and is used to statistically characterize:
· points as single cells,
· lines as connected sets of cells,
· polygons as all cells identifying the edge and interior of discrete parcels, and
· a surface as all of the cells within a project area with a value assigned to each that indicates the presence by feature type (discrete object) or the relative variable response (continuous gradient).
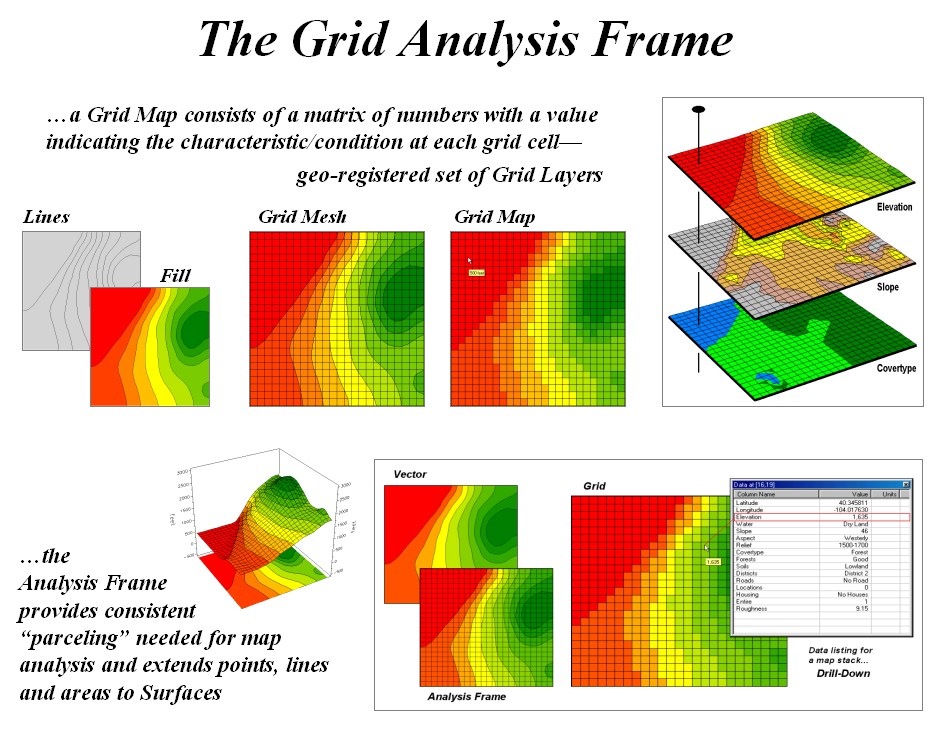
Figure
1-1. The grid-analysis frame is used to
represent geographic space as a continuum.
The top portion of figure 1-1 shows an elevation surface displayed as a traditional contour map, a superimposed analysis frame and a 2-D grid map. The highlighted location depicts the elevation value (1,635 feet) stored at one of the grid locations. The pop-up table at the lower-right shows the values stored on other map layers at another location. As the cursor is moved, the “drill-down” of values for different locations are instantly updated.
Connecting the grid lines at the center of each grid space forms the 3-D plot in the lower-left portion of the figure. The lengths of the lines are a function of the elevation difference between the values stored at adjacent grid spaces. The result is a “wireframe” plot that forms the peaks and valleys of the spatial distribution of the mapped data forming the surface. The color zones identify contour intervals that are draped on the frame. In addition to providing a format for storing and displaying map surfaces, the analysis frame provides the consistent structuring needed for advanced grid-based analysis operations.
MapCalc Learner-Academic Software
Grid-based map analysis involves four broad capabilities:
· surface modeling for mapping the spatial distribution from a set of point samples (e.g., spatial interpolation, trend surface analysis),
· data mining for characterizing numerical relationships within and among mapped data (e.g., map similarity, clustering and regression),
· spatial analysis for deriving new mapped data based on contextual relationships within and among mapped data (e.g., effective proximity, optimal paths, visual exposure, slope/aspect), and
· GIS modeling that logically sequences map analysis operations to characterize a system or solve a spatial problem.
The MapCalc Learner-Academic package contains two integrated
software systems addressing these capabilities.
The Surfer demo system by Golden Software (see online
links in the references section) is a special tutorial version of the popular
surface modeling and 2D/3D graphics system.
It contains several different interpolation techniques including Inverse Distance, Kriging, Minimum Curvature,
Polynomial Regression, Triangulation, Nearest Neighbor, Shepard's Method,
Radial Basis Functions, Natural Neighbor, Moving Average, and Local Polynomial. Its graphical output supports contour, 3D
surface, 3D wireframe, vector, image and shaded relief maps. Surfer has a robust set of data import/export
utilities including digitizer input. The
Surfer demo version included in the MapCalc Learner-Academic CD has all of the
functionality of the commercial system with the exception of plotter
support.
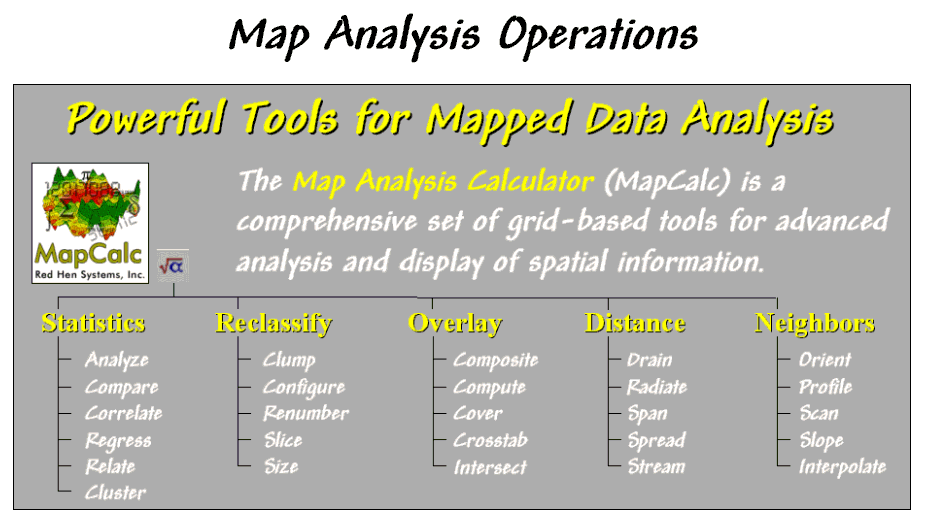
Figure
1-2. Listing of MapCalc functions—map
analysis operations.
The MapCalc tutorial software by Red Hen Systems (see online links in the references section) provides the data mining, spatial analysis and GIS modeling capabilities. It contains twenty-six analytical operations that are grouped into five classes—reclassify, overlay, distance, neighbors and statistics—as listed in figure 1-2. A description of each of the operations and numerous examples of their application are available online.
MapCalc capabilities involve two broad classes of analysis—spatial statistics and spatial analysis. Spatial Statistics tools investigate statistical patterns and relationships among maps. They include:
üDescriptive Statistics üNormality Tests üPoint Density Maps üGeographic Trend Analysis üSpatial Interpolation üSpatial Autocorrelation üScatter Plots and Variograms üResidual Analysis üError Mapping üCoincidence Statistics üChange Surfaces üComparison Tests üSpatial Correlation and Dependency üMultivariate Regression üClustering üMap Similarity.
Spatial
Analysis tools derive new maps based on spatial context, patterns, surface
configuration, proximity, connectivity and flows. They include:
üGeographic Search üWeighted
Proximity Analysis üSlope and
Aspect üVisual
Exposure üOptimal
Path üLocal,
Regional and Map-Wide Overlay üNearby
Neighbor Summary üEdge, Shape
and Pattern Characterization üNarrowness üLogical,
Ranking, Rating and Mathematical Combination
üConfluence Surfaces üPropensity
Analysis üTravel-Time
Surfaces üCompetition
Analysis.
Command entry in MapCalc is made through pop-up dialog boxes with each command forming a complete and grammatically correct English sentence that is added to the command macro log as it is executed. These macros can be edited, modified, and interleaved with descriptive notes then saved as scripts for re-execution. The use of an intuitive command language is ideally suited for teaching as complex programming languages often confuse and intimidate students with minimal computer expertise. MapCalc contain extensive “contextual help” and online documentation including several tutorials on system operation.
In addition, MapCalc has over fifty “tools” for displaying
maps, investigating data, charting, windowing, importing/exporting, and
managing map layers. All interaction
with the software is through graphical user interfaces and standard Windows
icons including buttons, scroll lists, hot-fields, etc. The interface is designed so most interaction
is completed through mouse-clicks with minimal keyboard entry. Data
is easily exchanged between Surfer and MapCalc and import routines
include most grid formats and popular desktop mapping files (e.g., ArcView .shp
and MapInfo .tab files). Students
can enter their own data as well as develop their own GIS models.
MapCalc Learner-Academic Educational Materials
The MapCalc Learner-Academic system comes in two forms—the MapCalc Learner package for students and the MapCalc Academic for instructors. Figure 1-3 summarizes the materials included in both the student and instructor versions.
The Learner CD contains MapCalc and Surfer educational software,
exercises/databases, application demos and two online texts—Map Analysis,
a compilation of the “Beyond Mapping” column in GEOWorld and Precision
Farming Primer, a compilation of the “Inside the GIS Toolbox” column in agInnovator. There is a cross listing of tutorial
exercises keyed to the electronic books and Joseph K. Berry’s other books Beyond
Mapping and Spatial Reasoning (Wiley & Sons publishers). In addition, there is a cross-reference of
MapCalc operations to those of other popular grid-based systems, such as ESRI’s
Spatial Analyst.
The Academic Software CD contains all of the material on the student CD with two important differences. Whereas the student version is constrained to a 100-column by 100-row analysis frame (10,000 cells for each map layer), the instructor version is only limited by the practical performance of the computers in the lab. Also, the student version has a single-seat license while the instructor version has a multiple-seat license for installing in a single computer lab. Both systems are licensed for educational use only and cannot be used for funded research or other commercial purposes. The MapCalc Professional version is available for revenue generating applications and contains several advanced features not included in the teaching and self-learning versions. The minimum computer environment for all versions is Windows 95/98/Me/2000/XP on a Pentium I platform with 64MB memory and 20 MB hard disk space available for each of the MapCalc and Surfer installations.
Figure 1-3. Outline of materials included in the student and instructor versions of MapCalc.
The Academic Supplemental CD (see online links in the references section) includes over 500MB of teaching materials supporting a variety of different presentation environments:
· GM_seminars containing instructional materials for a general seminar and half-day workshops on GIS Modeling including lecture presentations and hands-on exercises,
· GM_workshop with instructional materials for a one-day workshop in GIS Modeling with lecture presentations and workbook materials,
· PF_workshop containing instructional materials for a two-day workshop in Precision Agriculture with lecture presentations and exercises,
· GM_course with instructional materials for an upper-division course in GIS Modeling including lecture presentations, exams, readings, exercises and other support materials using MapCalc Learner software, and
· General_ppt containing over thirty other PowerPoint presentations on GIS Modeling, Precision Ag and other spatial technology topics presented at a variety of forums.
The materials are designed so instructors can adopt entire teaching packages or assemble custom sets by selecting parts of the prepared materials. Most of the presentation slides have embedded links to the electronic books and other support materials for those wishing more information on a topic.
Using MapCalc in Introductory Courses
The full set of MapCalc Learner-Academic teaching materials are intended for workshops, short courses and full-term classes. The general seminar and half-day workshop materials are well suited for infusing grid-based map analysis into introductory GIS courses. The seminar materials contain PowerPoint slides and real-time demonstrations for conveying basic concepts in the similarities and differences between vector and raster data, types of grid data, display forms, and example analysis. A simple model for deriving a map of erosion potential forms a conceptual thread tying the basic concepts together (see figure 1-4).
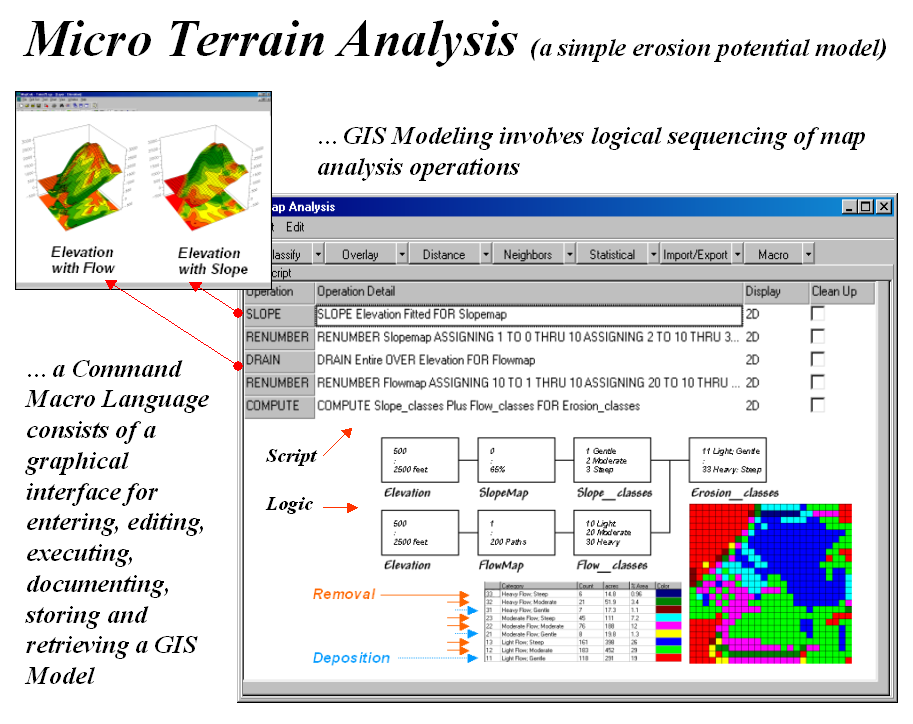
Figure 1-4. Map analysis steps for deriving a simple erosion potential map.
An elevation surface is used to demonstrate the characteristics of an analysis frame, 2D/3D display, shading manager, data inspection and general map display tools. Calculation of a slope map from the elevation surface introduces analysis concepts with a familiar terrain characteristic. Calculation of a flow map, however, challenges students to expand their thinking to an unfamiliar characteristic—every map location is assigned a value that indicates how many uphill locations contribute water flow through each cell. Displaying both maps as graphic overlays on the terrain surface, as shown in the upper-left portion of the figure, visually confirms the derived maps’ connection to micro terrain reality.
Combining the information in the slope and flow maps generates an erosion potential measure for each grid location—gentle slopes with minimal water flow identifies low erosion potential; conversely steep areas with a lot of water flow identifies high erosion potential. The common sense ingrained in the simple model’s logic allows students to focus on how the map analysis addresses a spatial problem. The fact that it is accomplished in five easy steps (English sentences formed by completing pop-up dialog boxes) and can be conceptualized as a flowchart (rectangles are maps; lines are commands) provides a good introduction to spatial reasoning. This basic introduction to map analysis can be presented in a standard 50-minute class meeting including the real-time demonstrations.
The half-day workshop materials provide more extensive exposure and “hands-on” experience. In addition to the erosion model, students complete several other exercises including grid data handling/display, habitat modeling, effective distance, visual exposure, diversity measures and a capstone exercise for campground location. The material is organized as one-third lecture and two-thirds hands-on exercises presented in four contact hours.
In addition to the classroom experience, students are encouraged to investigate and/or implement other GIS models as their interest warrants. Those having their own computers can purchase the inexpensive MapCalc Learner package for continued self-learning. The “take-home” option is ideally suited for professional learners who require a condensed experience followed by extensive opportunity for continued hands-on experience in their home environments.
Conclusion
The MapCalc Learner-Academic materials provide for an easy and inexpensive yet powerful experience in grid-based map analysis concepts, considerations and procedures. The PC-based software is easy to use, runs in generic environments without special licensing and encourages traditional and non-traditional students to continue learning outside of the classroom. As more and more students have their own computers it makes sense to have educational software available outside of the confines of a formal computer lab.
A large component to learning a new technology is ubiquitous access for simply “playing with it.” This coupled with extensive educational materials including exercises and example applications are key to a comprehensive understanding—for both students and instructors unfamiliar with the new techniques. Lecture materials that are not fully integrated with hands-on experience afford only a small foothold for learning. Couple this with 50-minute vignettes in a traditional GIS lab and lasting understanding is difficult to achieve. Like playing a piano, exposure to the basic cords is fundamental but practice is what makes a pianist. Unlike the piano, grid-based map analysis is no longer out of reach for most students. The MapCalc Learner-Academic materials bring the “other set of GIS capabilities” into play.
References
Note: Additional information
about the MapCalc Learner-Academic educational package is available at several
online sites.
·
www.redhensystems.com, select Product/Servicesà MapCalc.
The main MapCalc website with free evaluation download, ordering
information, examples and general description of the software and supporting
materials.
·
www.goldensoftware.com, select Productsà Surfer.
The main Surfer website with free evaluation download, ordering
information, examples and general description of the software and supporting
materials.
·
www.innovativegis.com/basis,
select links in the MapCalc section.
This page contains various links to examples, papers, and an online
version of the Map Analysis electronic book included on the MapCalc CD.
·
www.innovativegis.com/basis/Senarios/Materials,
select links to various example materials.
This page contains links to examples of the over 500MB of teaching
materials supporting MapCalc Learner-Academic.
·
www.innovativegis.com/basis/Senarios/Movies,
select a tutorial video. Several short
videos demonstrating MapCalc’s capabilities are available. The videos can be opened and executed without
storing them to your disk.
·
www.geoplace.com/gw/2001/0601/0601qt.asp. A GEOWorld Quick-Take Review of the
MapCalc Learner software for students. A
Geospatial Solutions review of the MapCalc Learner-Academic educational
materials for instructors is in preparation.
The MapCalc software
by Red Hen Systems (www.redhensystems.com)
has extensive capabilities in spatial analysis and statistics. The Surfer software by Golden Software
(www.goldensoftware.com) provides
extended capabilities in surface modeling and 3-D graphics. The MapCalc tutorial version is constrained
to a 100x100 grid configuration (10,00 grid cells) and some of Surfer’s output
features are constrained in the tutorial version. Both software systems have data exchange
tools and accept data for creating your own databases.
The
MapCalc
Learner
package is designed for student and self-learning and licensed for educational
use on a single computer. It is
distributed on a single CD for US$21.95 plus shipping and handling. The MapCalc Academic package is designed for
instructors and contains all of the Learner materials plus lecture
PowerPoint’s, additional exercises, one-day workshop and full introductory
course materials supporting classroom instruction. The classroom materials are the result of
over 30 years of GIS teaching experience and have been honed in hundreds of
workshops and numerous college courses on map analysis. The Academic package includes a multiple-seat
license for educational use in a single computer lab and is distributed on two
CDs for US$495.00 plus shipping and handling.
________________________
Joseph K. Berry is a leading
consultant and educator in the application of Geographic Information Systems
(GIS) technology. He is the president of
BASIS, consultants and software developers in GIS and the author of the “Beyond
Mapping” column for GEOWorld magazine.
He has written over two hundred papers on the theory and application of
map analysis, and is the author of the popular books Beyond Mapping and Spatial
Reasoning. Since 1976, he has
presented workshops on GIS to thousands of individuals from a wide variety of
disciplines. Dr. Berry conducted basic
research and taught courses in GIS for twelve years at Yale University's
Graduate School of Forestry and Environmental Studies, and is currently a
Special Faculty member at Colorado State University and the W. M. Keck Visiting
Scholar in Geography at the University of Denver. He holds a B.S. degree in forestry, an M.B.A.
in business management and a Ph.D. emphasizing remote sensing and land use
planning.