| Linking
Data and Map Distributions |
| A
histogram depicts the numerical distribution |
||
| A map depicts the geographical distribution |
||
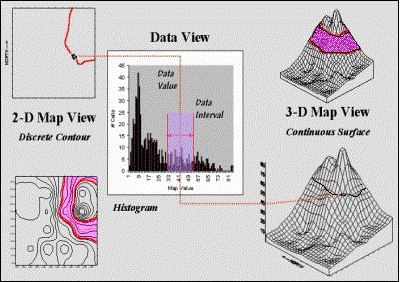
| …the
data values |
|||||||||
| link
the two views— |
|||||||||
| Click
anywhere on |
|||||||||
| the map and
the |
|||||||||
| histogram
interval |
|||||||||
| is
highlighted; click |
|||||||||
| on a
histogram |
|||||||||
| interval and
the |
|||||||||
| map
locations are |
|||||||||
| highlighted |
|||||||||
| (Berry) |