 |
|
|
|
|
|
|
|
|
|
|
|
|
|
|
|
|
|
|
|
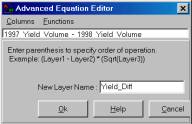
Comparing
Map Surfaces (Difference map)
|
|
|
|
|
|
1997_Yield_Volume
|
|
|
-
1998_Yield_Volume
|
|
|
|
|
|
Map
Variables… map
values within an analysis grid can
|
|
be mathematically and
statistically analyzed
|
|
|
|
|
|
|
 |
|
|
|
|
|
|
|
|
|
|
 |
|
|
 |
|
|
|
|
|
|
|
|
|
|
|
…green indicates
|
|
|
areas
of increased
|
|
production
|
|
|
…yellow indicates
|
|
|
minimal
change
|
|
|
…red indicates
|
|
decreased
production
|
|
|
|
|
|
|
|
|
|