Mapping Yield Data
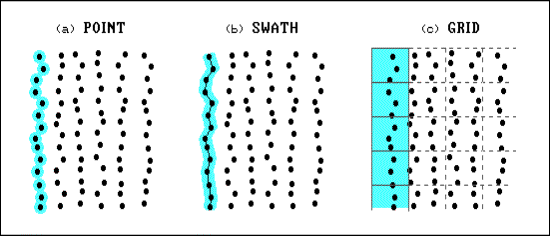
Point Map
-- dot at each yield point
Swath Map
-- rectangle along path summarizing 2 or more points
Grid Map
-- square summarizing points within (and near)
…colors assigned to each dot, rectangle or square based on the
yield measurements
(
Berry
)