Applying MapCalc Map Analysis Software
Determining Visual Exposure: A land planner needs to determine areas
are that are highly visible from the road network for consideration in a new
development plan for the county.
<click
here> for a printer friendly
version (.pdf)
Processing Flow.
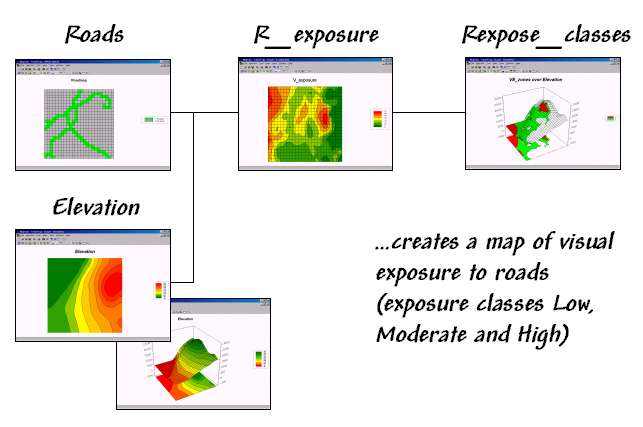
Base Maps. The Base Maps needed include:
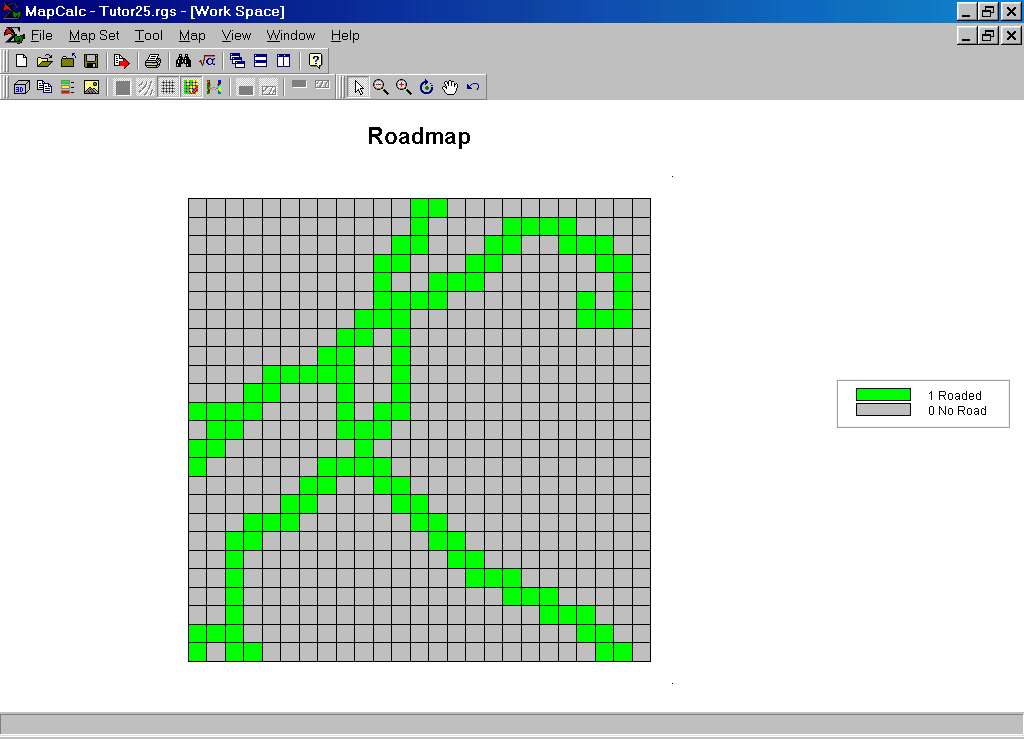 Roadmap. Each grid cell serves as a “viewer location.”
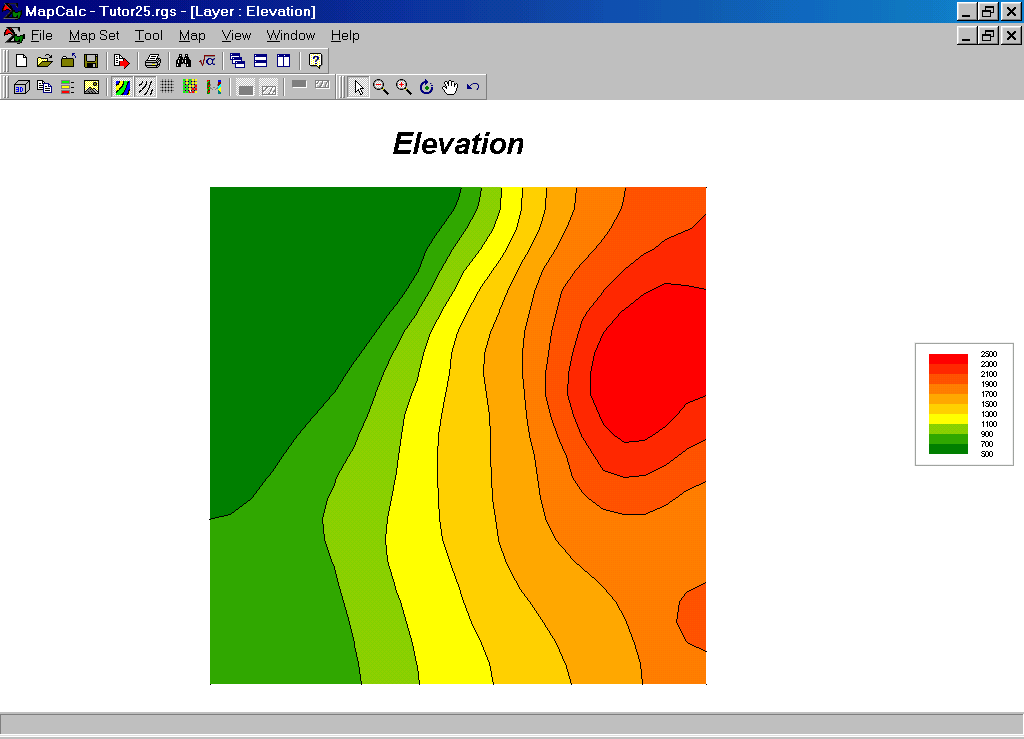
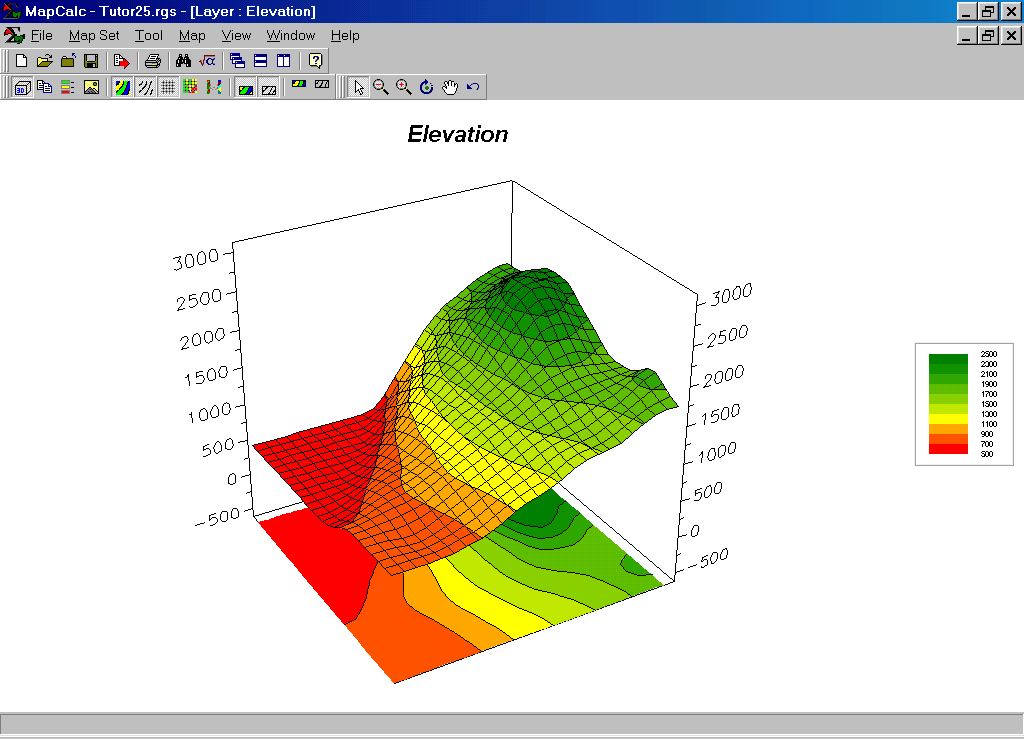 Elevation Map. The terrain configuration affects the visual
connection from each road location to all other grid cells in the area.
Elevation Map. The terrain configuration affects the visual
connection from each road location to all other grid cells in the area.
Step 1. The MapCalc operation…
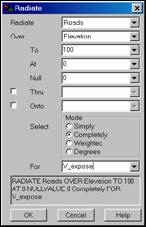 Radiate roads to 100 over elevation
completely for V_exposure
Radiate roads to 100 over elevation
completely for V_exposure
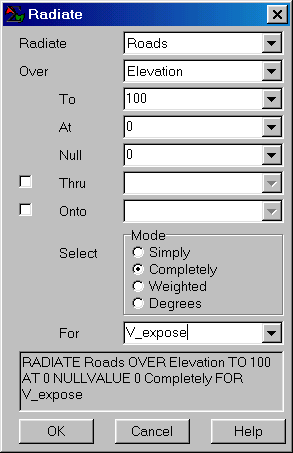
…creates a visual exposure map identifying how many road locations are seen from each grid cell in the area.
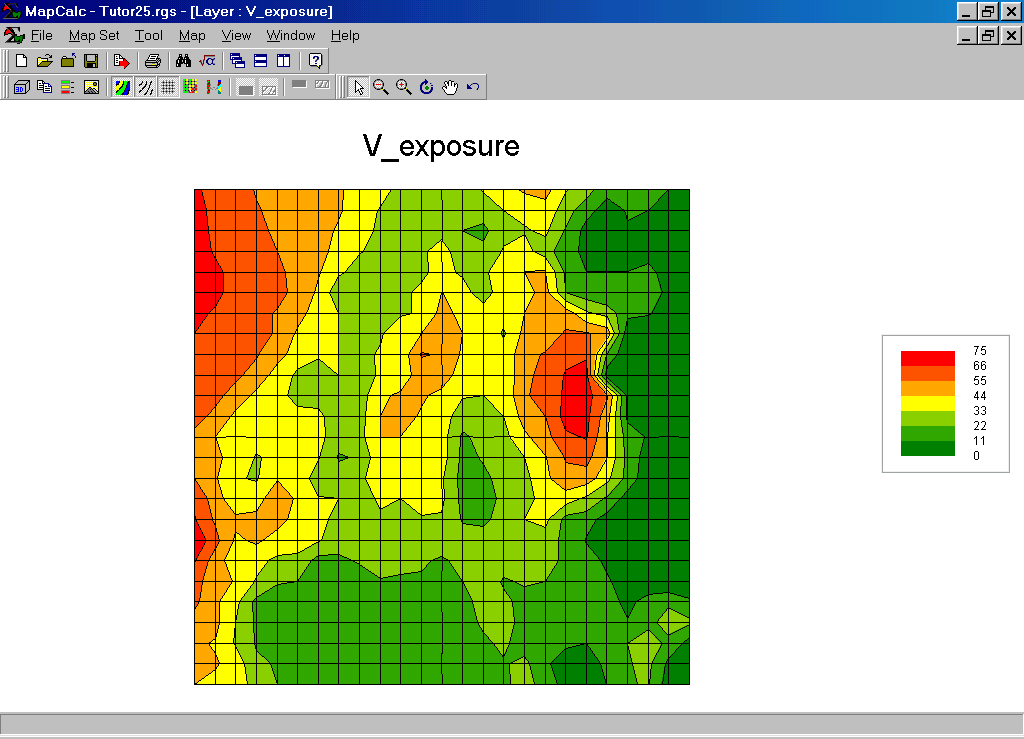 V_exposure Map. Note that the highest visual exposure (red) is
occurs along the western edge and central portions of the area. The least visually exposed areas (green) are
on the southern and eastern edges.
V_exposure Map. Note that the highest visual exposure (red) is
occurs along the western edge and central portions of the area. The least visually exposed areas (green) are
on the southern and eastern edges.
Step 2. The MapCalc operation…
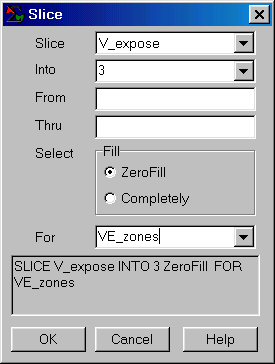 Slice V_exposure into 3 for VE_zones
…creates a map of low, medium and high visual exposure to roads.
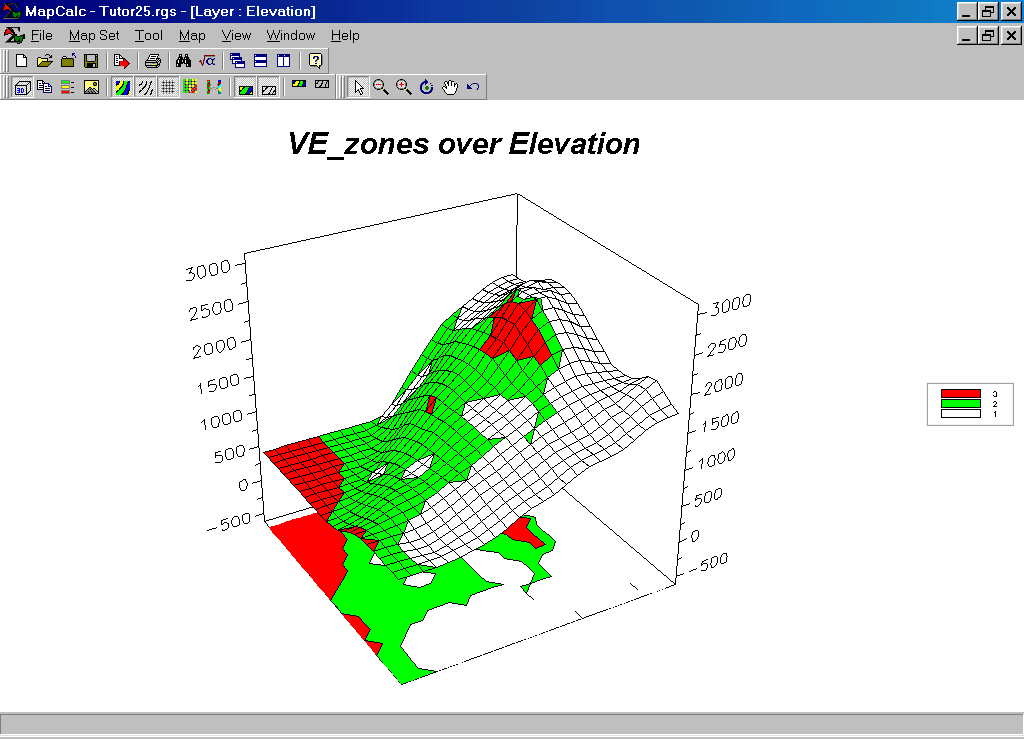
VE_zones draped over the Elevation Map. The color zones draped on a 3D surface identify
areas of high visual exposure (red), medium exposure (green) and low exposure
(white). The areas of high and medium
exposure can be exported in a variety of vector and grid formats for use in
other
Summary.
By completing two short dialog boxes, a land planner can determine
visually sensitive areas and direct unsightly development elsewhere. Visual exposure is an import consideration in
many aspects of land planning. Until
recently, these capabilities were only offered in complex and expensive full