Applying MapCalc Map Analysis Software
Using MapCalc’s Shading Manager for Displaying
Discrete Maps: While
grid-based systems are best suited for processing and displaying continuous maps,
there are several considerations for grid-based display of discrete map data.
<click
here> for a printer friendly
version (.pdf)
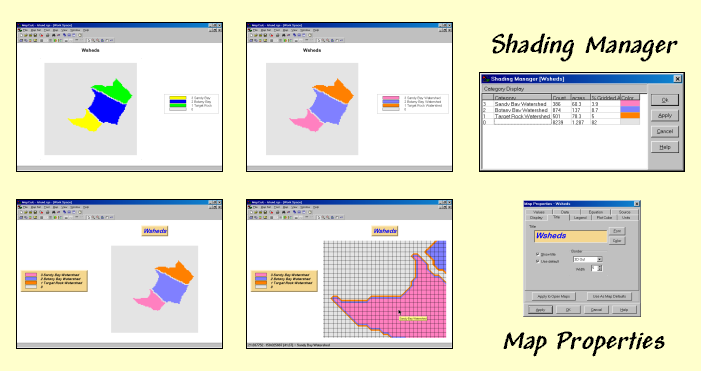
Summary of MapCalc Shading Results.
Understanding the Difference between Continuous and Discrete Maps. The characteristics of the map values determine whether a map is Continuous or Discrete.
 Elevation Surface (Continuous). All grid-based data (also referred to as
“raster” data) is represented as a matrix of numbers. Continuous maps contain values that form a
continuum in both numeric and geographical space, such as an elevation map,
temperature gradient or sales density surface.
The range of values on the map is divided into contour intervals
and colors are assigned to each interval.
Elevation Surface (Continuous). All grid-based data (also referred to as
“raster” data) is represented as a matrix of numbers. Continuous maps contain values that form a
continuum in both numeric and geographical space, such as an elevation map,
temperature gradient or sales density surface.
The range of values on the map is divided into contour intervals
and colors are assigned to each interval.
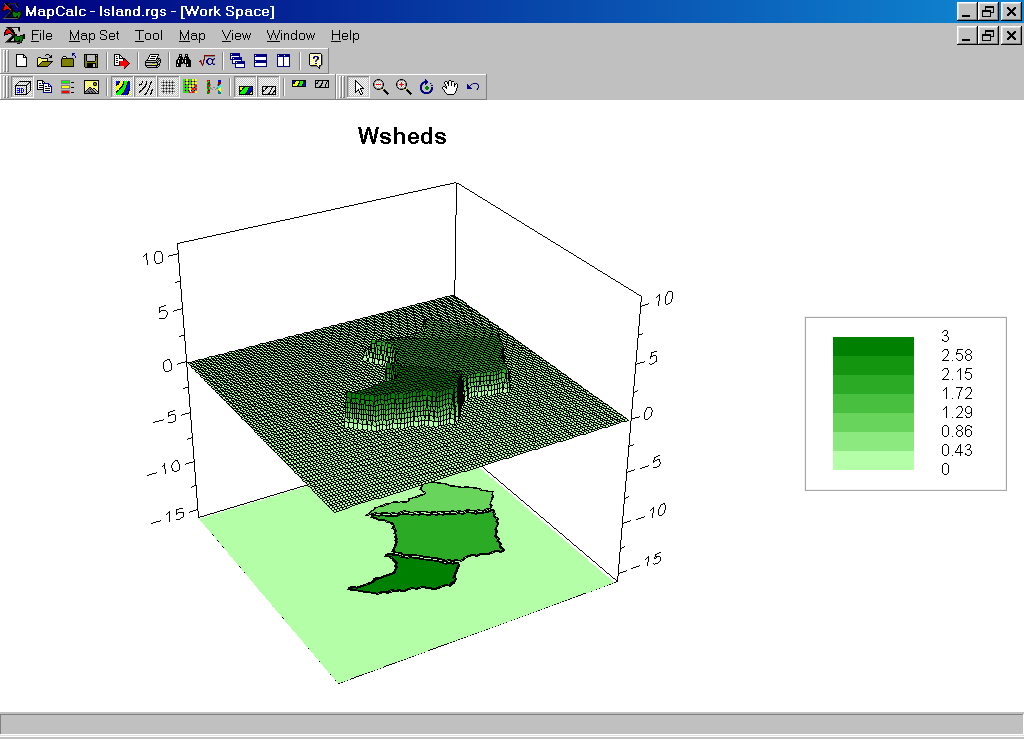 Watershed Map (Continuous). Discrete map data, on the other hand, does
not infer a continuous range of data values.
For example, a watershed map might contain only four numbers— 0 for no
information and values 1, 2 and 3 assigned to three different watersheds. If these data are displayed as continuous
data the software assigns a set of contours and color gradient to the data
range— 0 to 1 divided into eight contour intervals as shown in the figure.
Watershed Map (Continuous). Discrete map data, on the other hand, does
not infer a continuous range of data values.
For example, a watershed map might contain only four numbers— 0 for no
information and values 1, 2 and 3 assigned to three different watersheds. If these data are displayed as continuous
data the software assigns a set of contours and color gradient to the data
range— 0 to 1 divided into eight contour intervals as shown in the figure.
Also, continuous data assumes the map values are numerically related and a 3D plot shows the progression from low to high values. In this instance the values do not imply a numerical relationship and it would be silly to show them as a 3D surface.
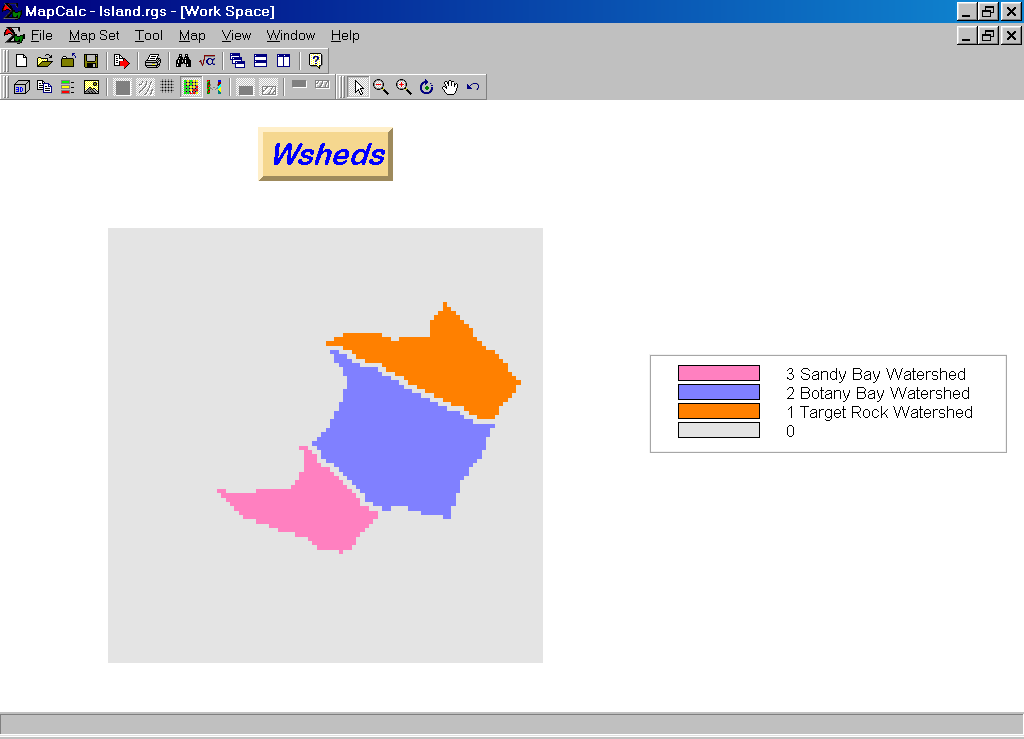
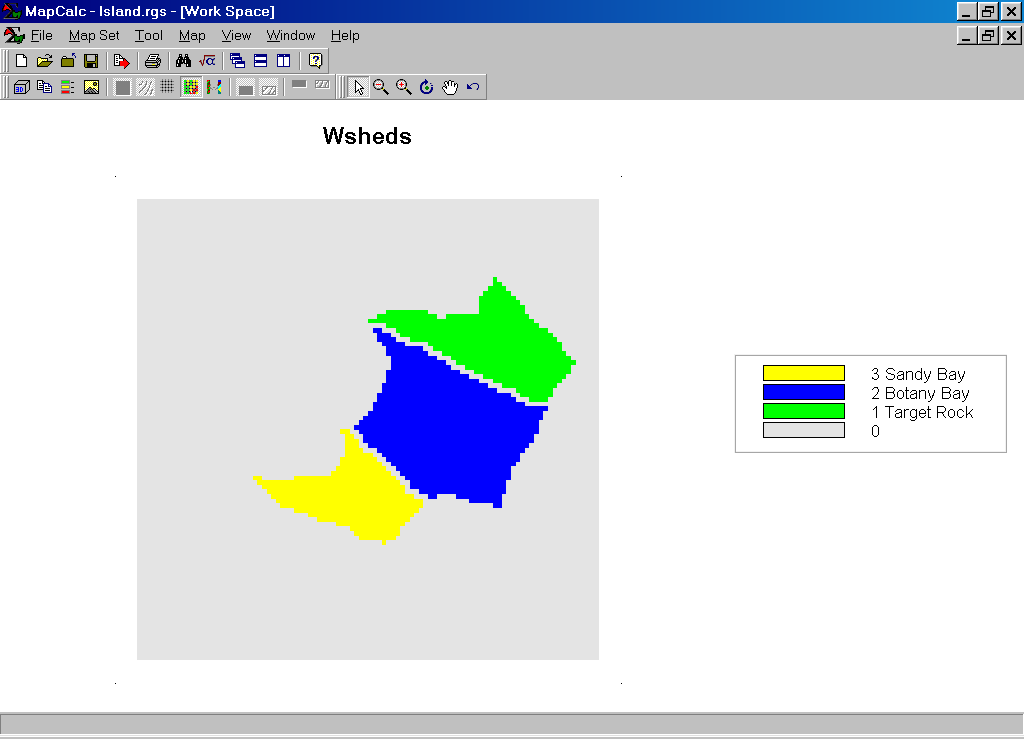 Watershed Map (Discrete). Discrete maps are generally displayed in 2D
with category labels (not the map values) providing information about the map
features. This display was generated by
pressing the 3D Toggle (set to 2D display) and Data Type
(set to discrete data) buttons on MapCalc’s tool bar (or from the Main Menu
under the Map item).
Watershed Map (Discrete). Discrete maps are generally displayed in 2D
with category labels (not the map values) providing information about the map
features. This display was generated by
pressing the 3D Toggle (set to 2D display) and Data Type
(set to discrete data) buttons on MapCalc’s tool bar (or from the Main Menu
under the Map item).
Assigning Colors, Map Title and Labels. A different color scheme can be applied by right-clicking on the map then selecting the “Shading Manager” (or clicking on the “Shading Manager” button on the tool bar; or from the Main Menu, select Mapà Shading Manager)…
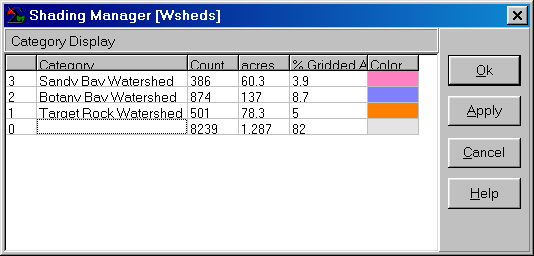
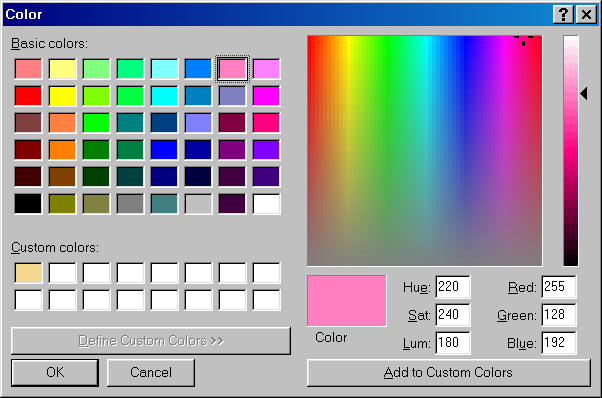 Shading Manager Box (Discrete Data) and
Pop-Up Color Pallet. The color
for a discrete map category can be changed by selecting it, then choosing a new
color from a pop-up pallet. In this
example a pink shade was assigned to
Watershed number 3,
Shading Manager Box (Discrete Data) and
Pop-Up Color Pallet. The color
for a discrete map category can be changed by selecting it, then choosing a new
color from a pop-up pallet. In this
example a pink shade was assigned to
Watershed number 3,
Category labels can be changed simply by clicking on the text and modifying them. In this example the word “watershed” was added to each of the labels.
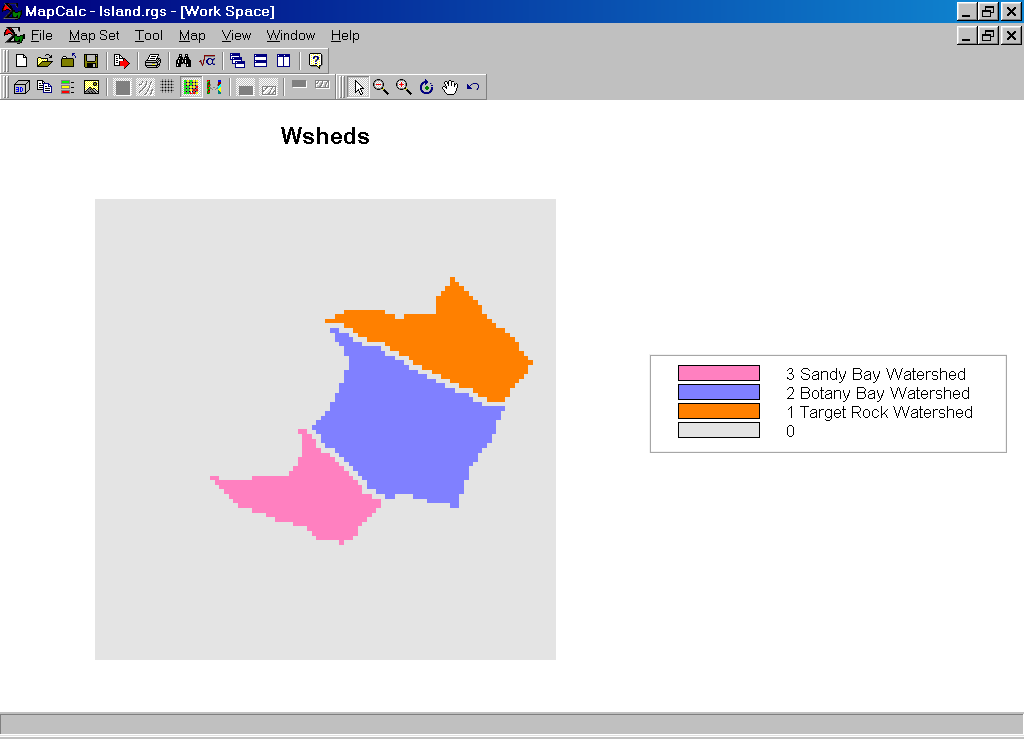 Watershed Map (changed colors).
Changing Map Properties for Display . The map’s Title and Legend formats can be changed by right-clicking on the map then selecting “Properties” (or from the Main Menu, select Mapà Properties)…
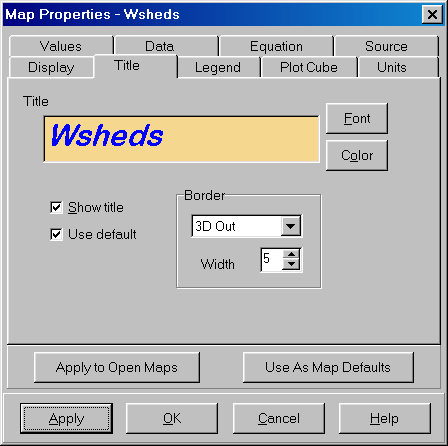 Map Properties Box (Title tab). The Title tab in the properties
box allows you to customize the appearance of the title in the display. In this example, a blue italicized Aerial
font at 18-pitch was specified (Font and Color buttons). A “3D Out” border was selected.
Map Properties Box (Title tab). The Title tab in the properties
box allows you to customize the appearance of the title in the display. In this example, a blue italicized Aerial
font at 18-pitch was specified (Font and Color buttons). A “3D Out” border was selected.
 Watershed Map (changed title).
Changing Between Grid and Vector Display Types. All
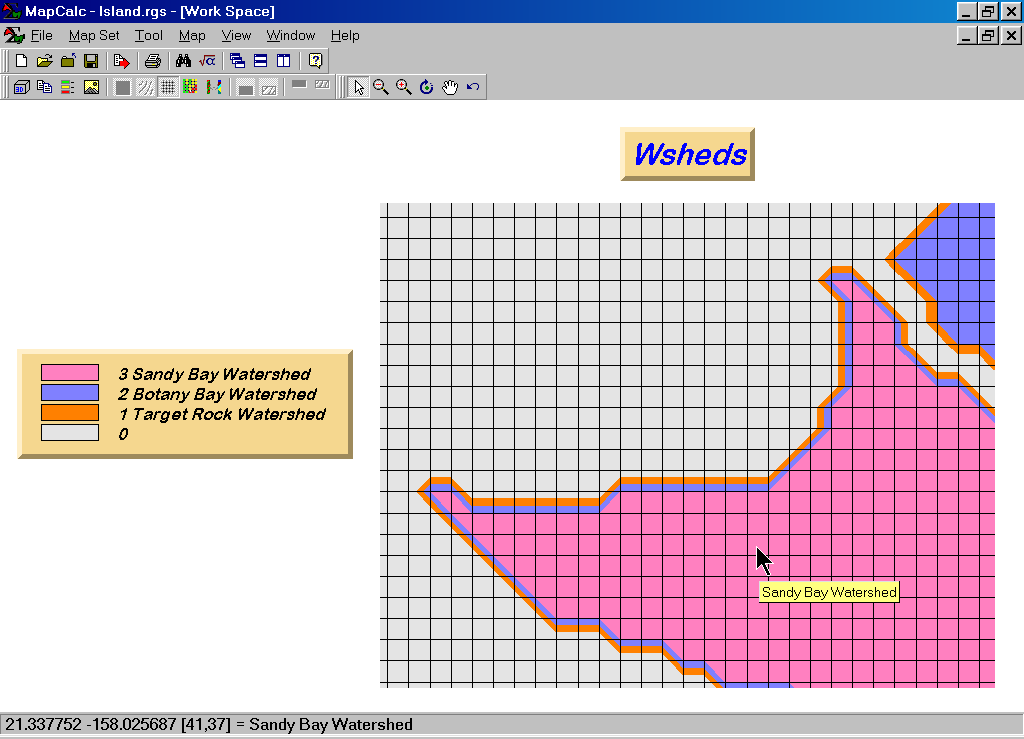 Watershed Map (changed legend, display
type and zoomed to a portion of the map area).
Watershed Map (changed legend, display
type and zoomed to a portion of the map area).
Changing Between Grid and Vector Display Types. If you attempt to display a continuous map as a discrete map a warning message of “This map has too many discrete values. Do you want to continue?” If you respond yes, the map will be displayed as discrete but the legend will contain a large number of unique colors—one for every value on a map…
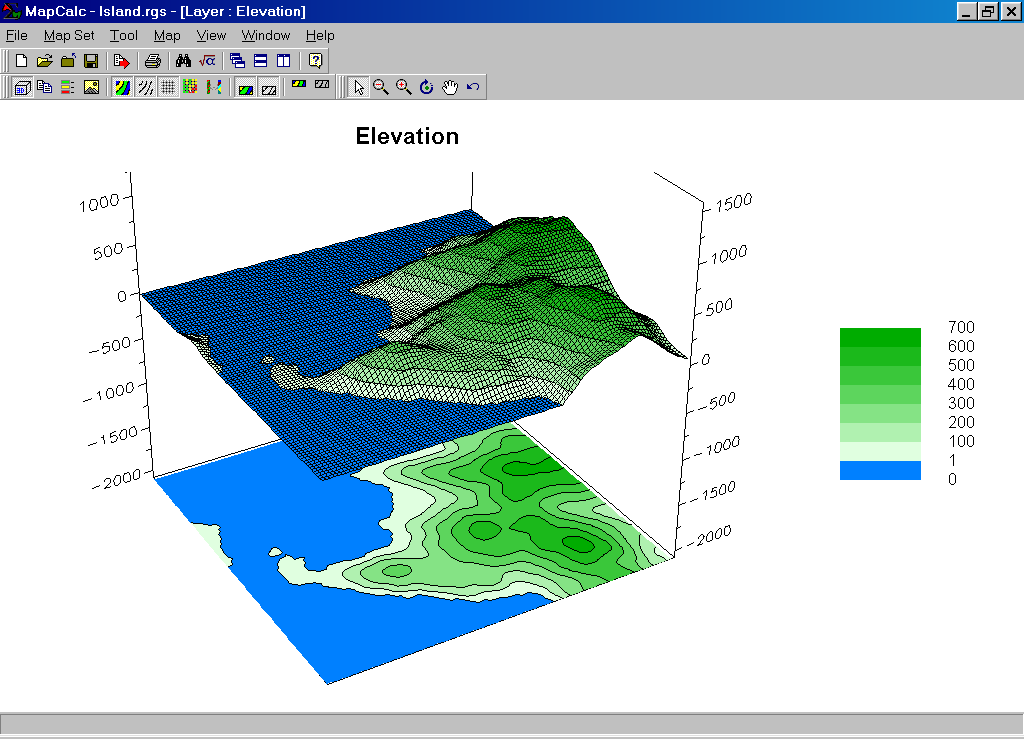
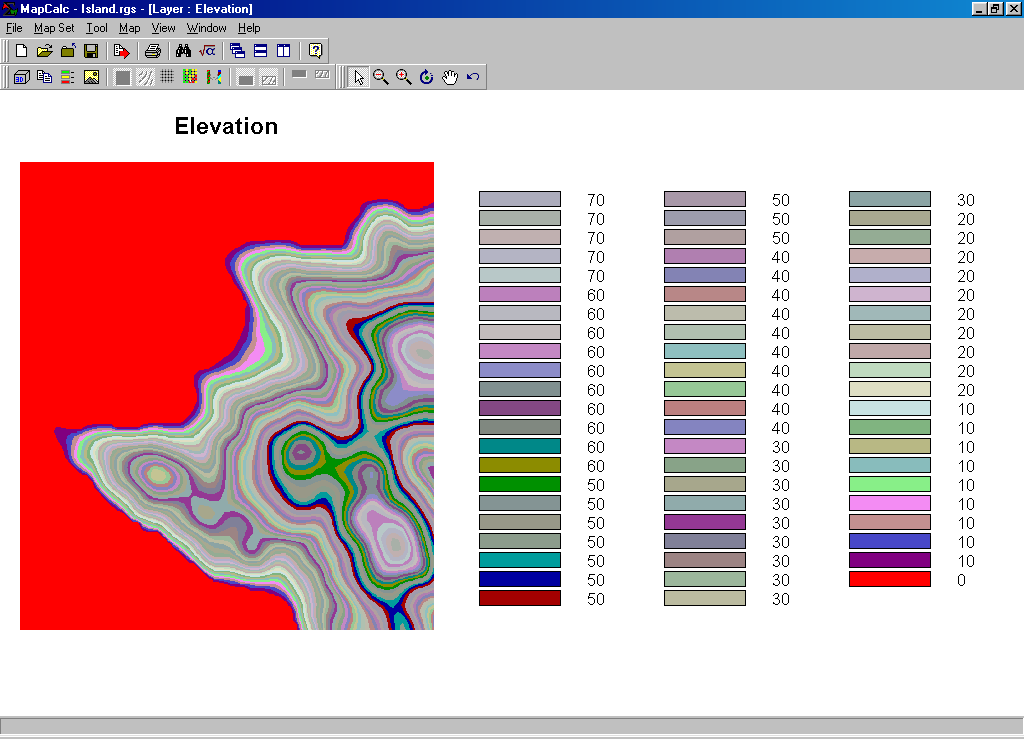 Elevation Surface Displayed as Discrete
Map. Actually there are hundreds of separate
numbers and, although MapCalc tried to display as a discrete map, its default
pallet is limited to just 64 colors.
Generally speaking, it is inappropriate to display continuous maps as
discrete and discrete maps as continuous—they are different data types.
Elevation Surface Displayed as Discrete
Map. Actually there are hundreds of separate
numbers and, although MapCalc tried to display as a discrete map, its default
pallet is limited to just 64 colors.
Generally speaking, it is inappropriate to display continuous maps as
discrete and discrete maps as continuous—they are different data types.
Summary. The map values comprising Discrete maps do not form a continuous gradient and therefore contour interval assignment is inappropriate. By switching from continuous to discrete data type (Data Type button on MapCalc’s tool bar) a unique color is assigned to each individual map value.
When attempting to view a map, you should first consider its Data Type (Discrete or Continuous) then decide on the Display Type (Lattice or Grid and 2D or 3D) and finally the Color Intervals/Pallet (Shading Manager) to use.