Applying MapCalc Map Analysis Software
Creating an
<click
here> for a printer friendly
version (.pdf)
)
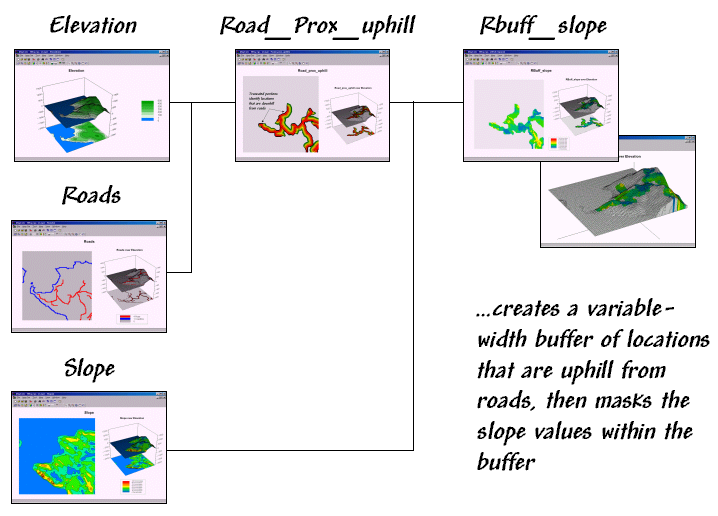
Processing Flows.
Base Maps. The Base Maps needed include:
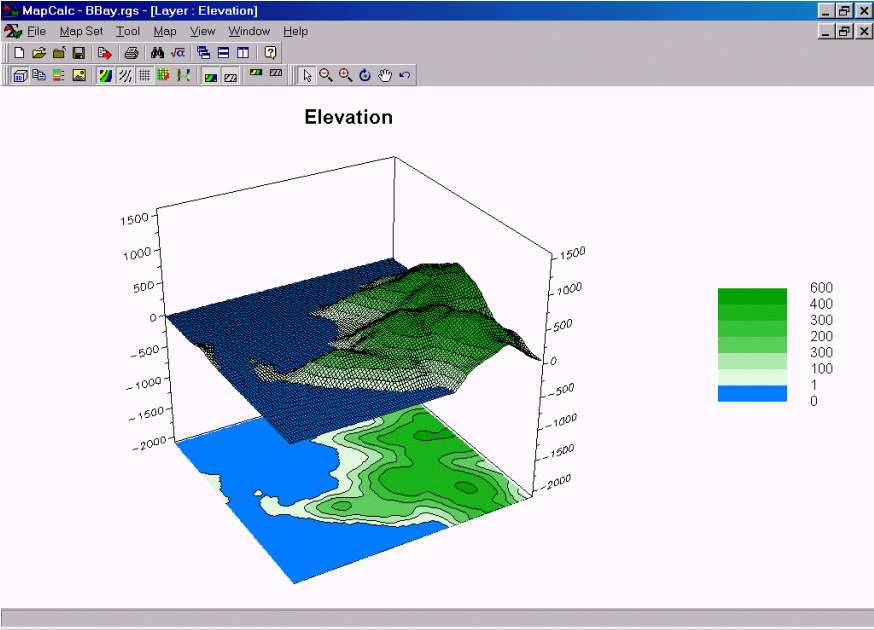 Elevation Map. Each grid location is assigned its elevation
above sea level. The analysis window for
the Island database is 100 columns by 100 rows (10,000 sample grids)
with a grid resolution of 82.5 feet. The
land area comprises 48% of the analysis window.
Elevation Map. Each grid location is assigned its elevation
above sea level. The analysis window for
the Island database is 100 columns by 100 rows (10,000 sample grids)
with a grid resolution of 82.5 feet. The
land area comprises 48% of the analysis window.
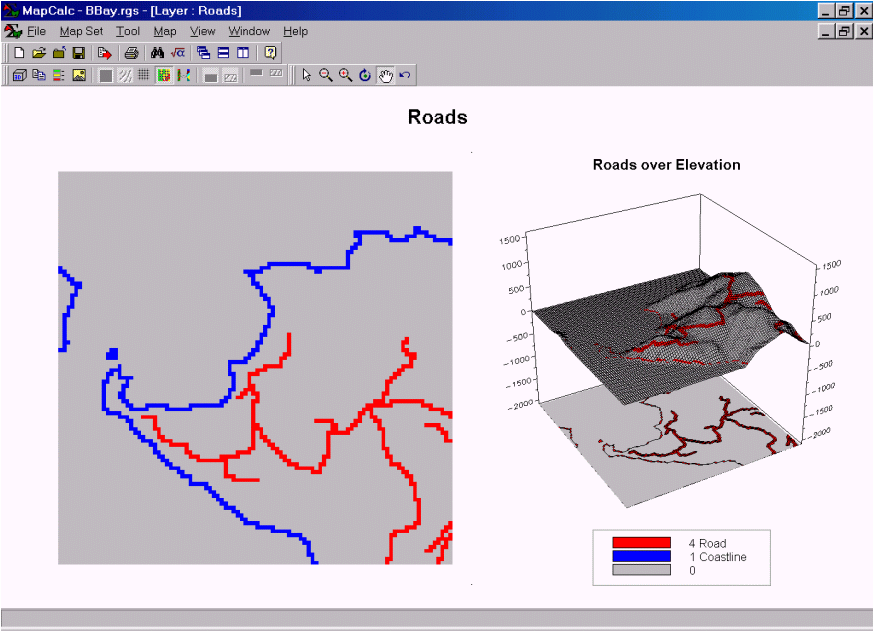 Road Map. Each grid location is assigned a 4 if a road
is present; 1 for the coastline. This
map was used to create a map (Roadnet) of just the roads— RENUMBER Roads
ASSIGNING 0 TO 1 FOR Roadnet.
Road Map. Each grid location is assigned a 4 if a road
is present; 1 for the coastline. This
map was used to create a map (Roadnet) of just the roads— RENUMBER Roads
ASSIGNING 0 TO 1 FOR Roadnet.
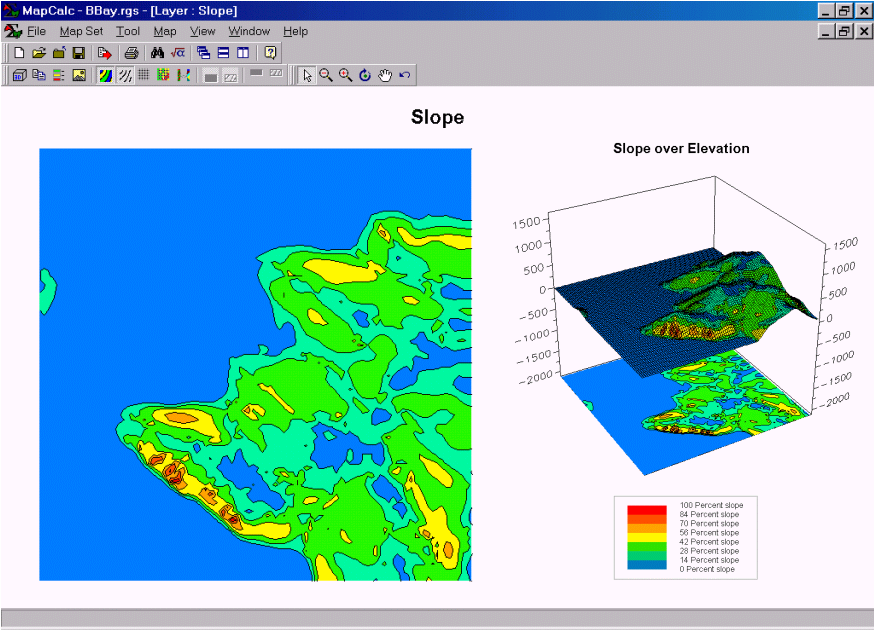 Slope Map. Each grid location is assigned a value
indicating the percent slope at that location.
The map was created by entering the operation— SLOPE Elevation Fitted
FOR Slope.
Slope Map. Each grid location is assigned a value
indicating the percent slope at that location.
The map was created by entering the operation— SLOPE Elevation Fitted
FOR Slope.
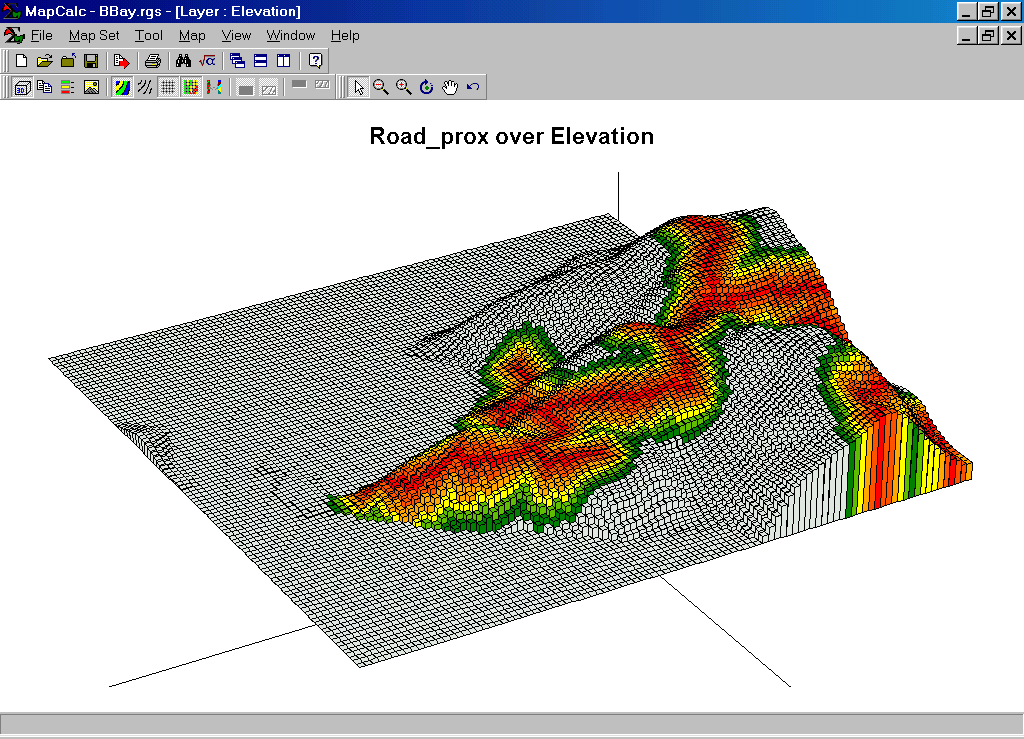
Step 1. The MapCalc operation…
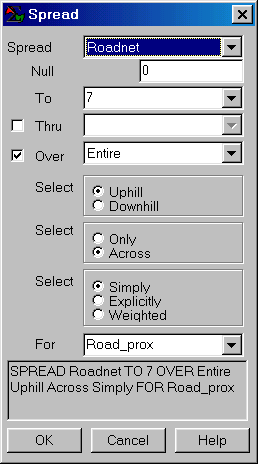 SPREAD Roadnet TO 7 OVER Entire Uphill Across
FOR Road_prox.
SPREAD Roadnet TO 7 OVER Entire Uphill Across
FOR Road_prox.
…creates a proximity map that identifies the distance from the closest road location. The “TO 7” phrase specifies that proximity will be measured up to seven grid cells (areas 7 cells or more away are assigned the value 7). The phrases “OVER Entire Uphill Across” directs the computer to measure proximity to the road network over the entire land mass (not in the ocean).
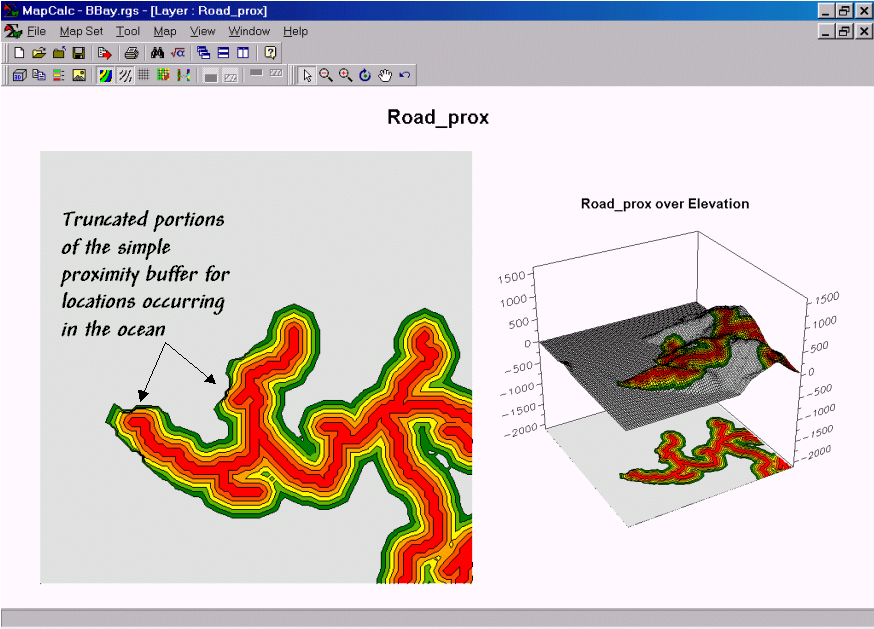 Road_prox Map. The buffered area consists of a series of
concentric bands around the road cells (bright red = 0 cells away from the nearest road
location). The dark green band locates the farthest locations within the
buffered area (82.5ft/cell x 7 cells = 578 feet). Note the truncation of the buffer that occurs
along northwest portions. This is the
result of measuring proximity for just the land mass— the truncated portions
Road_prox Map. The buffered area consists of a series of
concentric bands around the road cells (bright red = 0 cells away from the nearest road
location). The dark green band locates the farthest locations within the
buffered area (82.5ft/cell x 7 cells = 578 feet). Note the truncation of the buffer that occurs
along northwest portions. This is the
result of measuring proximity for just the land mass— the truncated portions
The MapCalc operation…
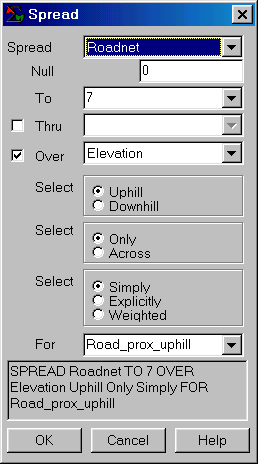 SPREAD Roadnet TO 7 OVER Elevation Uphill
Only FOR Road_prox_uphill.
SPREAD Roadnet TO 7 OVER Elevation Uphill
Only FOR Road_prox_uphill.
…creates a proximity map that only considers locations that are uphill from the road network. The “OVER Elevation Uphill Only” phrase directs the computer to measure distance just uphill from the roads.
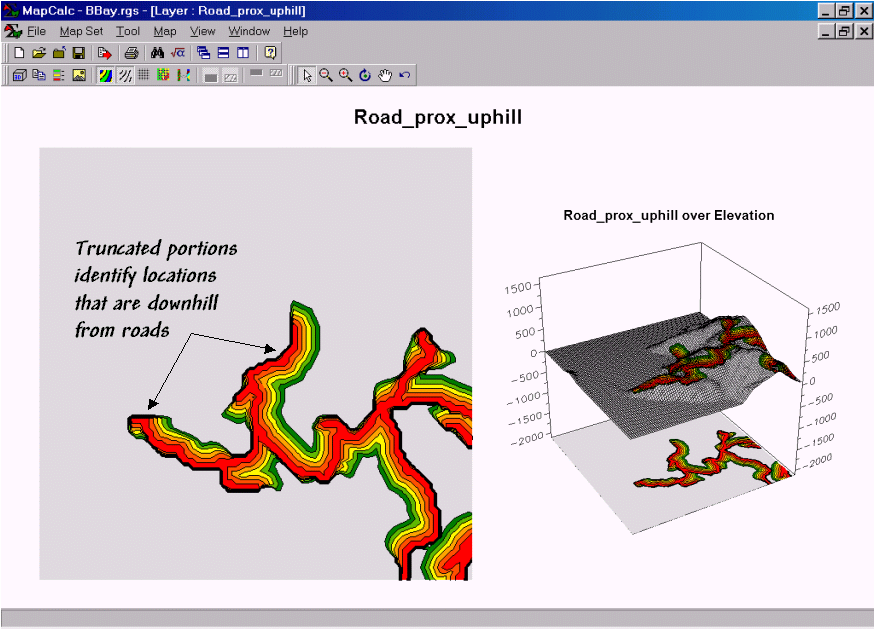 Road_prox_uphill Map. Traditionally,
buffers indicate simple distance “as-the-crow-flies” extending an equal
amount on either side of a feature. A
variable-width buffer, on the other hand, reaches out farther under some
conditions and not as far under others.
In this example, the buffer only was allowed to reach out for uphill
locations— the threat of rocks rolling uphill onto the road is improbable.
Road_prox_uphill Map. Traditionally,
buffers indicate simple distance “as-the-crow-flies” extending an equal
amount on either side of a feature. A
variable-width buffer, on the other hand, reaches out farther under some
conditions and not as far under others.
In this example, the buffer only was allowed to reach out for uphill
locations— the threat of rocks rolling uphill onto the road is improbable.
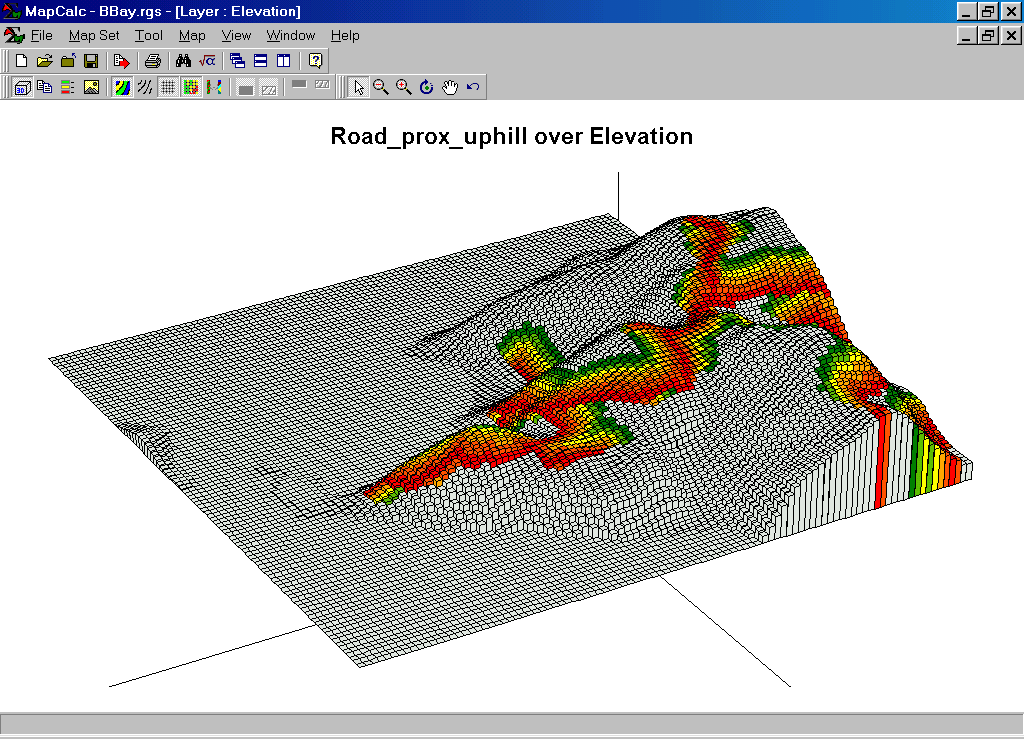
Comparison of simple and uphill buffers. Note the dramatic differences between the to buffer maps. In many applications, variable-width buffers are much more realistic than fixed-width ones.
Step 2. The MapCalc operation…
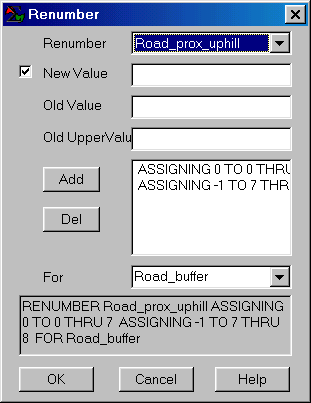 RENUMBER Road_prox_uphill ASSIGNING 0
TO 0 THRU 7 ASSIGNING -1 TO 7 THRU
8 FOR Road_buffer.
RENUMBER Road_prox_uphill ASSIGNING 0
TO 0 THRU 7 ASSIGNING -1 TO 7 THRU
8 FOR Road_buffer.
…creates a “masking map” by isolating all of the locations within the uphill buffer area.
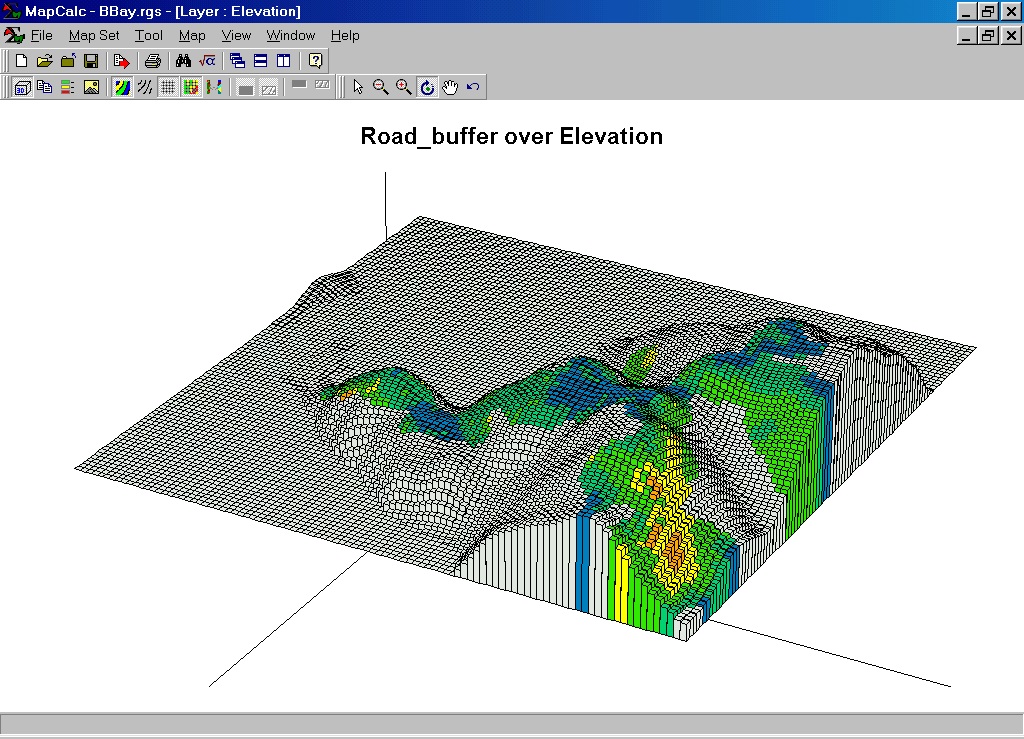
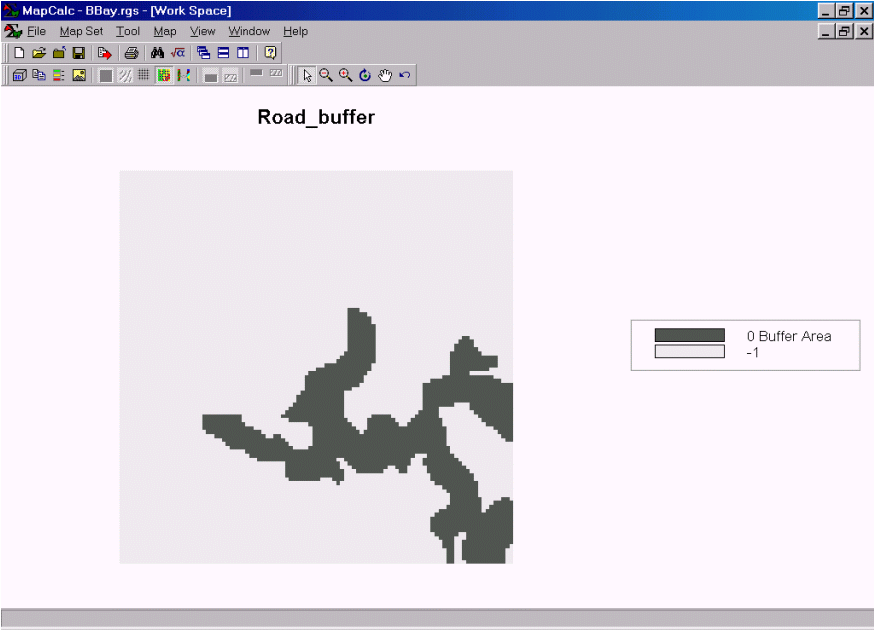 Road_buffer Map. Note that the value 0 was assigned to the
buffer while the value –1 was assigned to the area outside the buffer— this
choice of values will become apparent in the next operation.
Road_buffer Map. Note that the value 0 was assigned to the
buffer while the value –1 was assigned to the area outside the buffer— this
choice of values will become apparent in the next operation.
Step 3. The MapCalc operation…
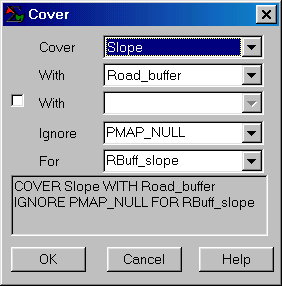 COVER Slope WITH Road_buffer FOR
RBuff_slope.
COVER Slope WITH Road_buffer FOR
RBuff_slope.
…creates a map that “masks” the slope information for just the buffered area. During processing, zero values on the Road_buffer map are treated as transparent and allow the slope values to show through. The –1 values are treated as opaque and cover-up any slope information.
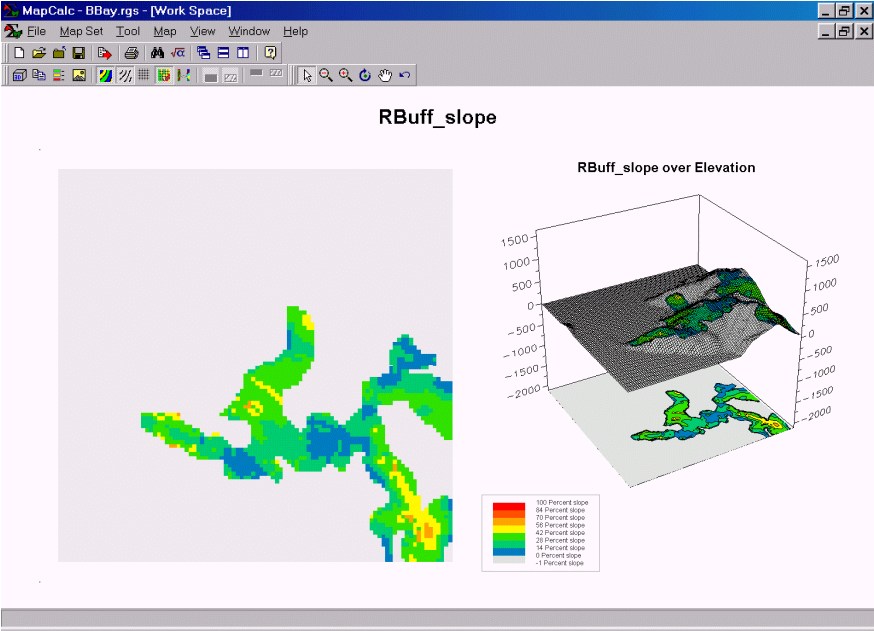 Rbuff_slope Map. This map shows the slope values for the areas
within the uphill buffer. The dark blue areas are relatively flat; the yellow to bright red
areas are relatively steep and can present earth slippage problems.
Rbuff_slope Map. This map shows the slope values for the areas
within the uphill buffer. The dark blue areas are relatively flat; the yellow to bright red
areas are relatively steep and can present earth slippage problems.
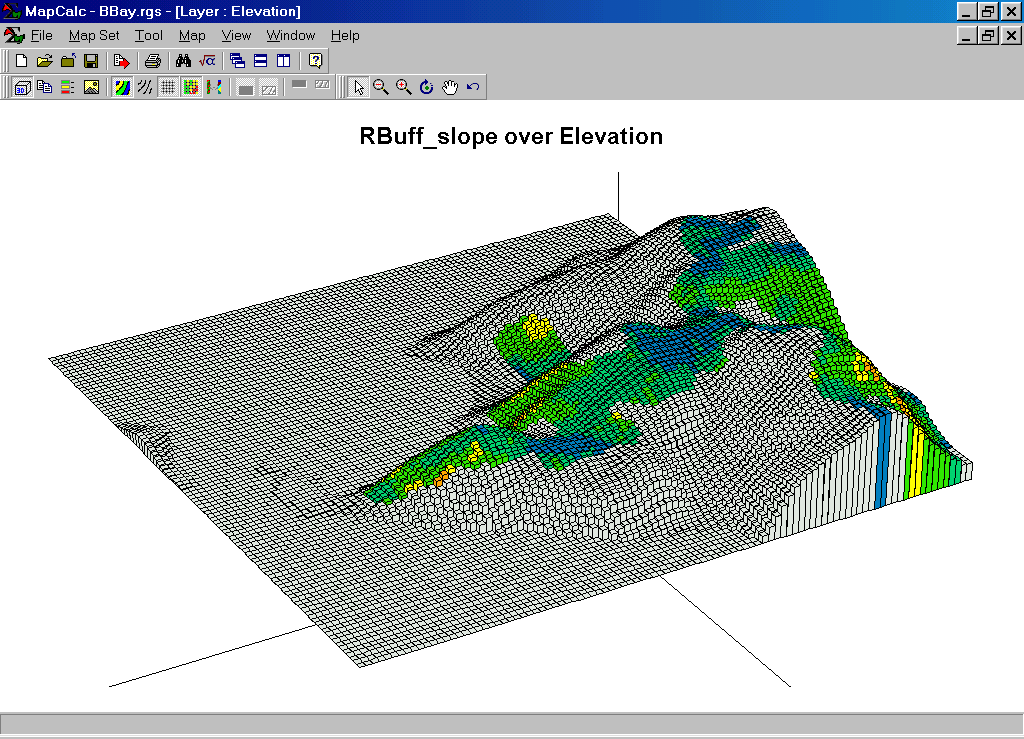
Rbuff_slope over Elevation Maps. The elevation surface with “draped” slope information can be rotated for different perspectives to better view areas of interest.
Summary. Information on the relative steepness for areas uphill from roads can be generated in three simple steps— Spread, Renumber, Cover. The ability to create variable-width buffers is only possible through advanced grid-based analysis.