Applying MapCalc Map Analysis Software
Characterizing Narrowness: A wildlife biologist needs a map that
identifies the relatively narrow portions of each vegetation parcel in a
project area. This
information will be analyzed with radio-collar data to determine patterns of
animal movement with respect to land cover narrowness.
<click here> for a
printer friendly version (.pdf)
Processing Flow.
Base Maps. The Base Maps needed include:
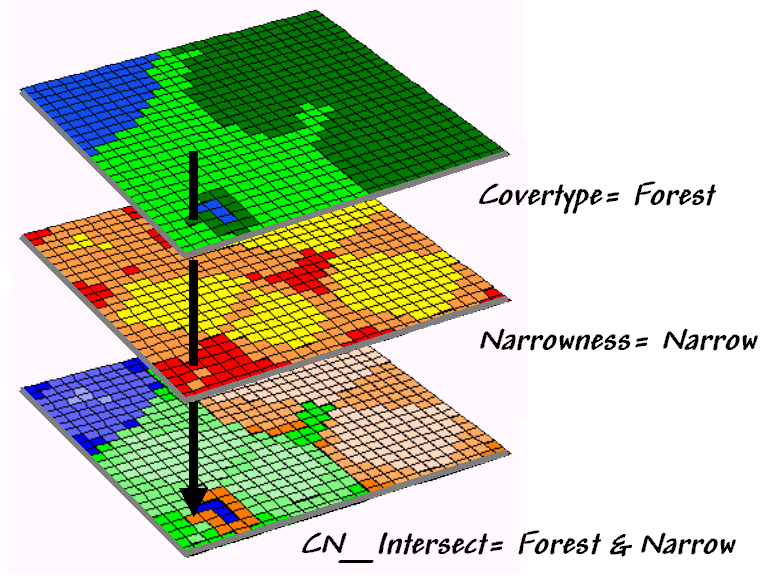
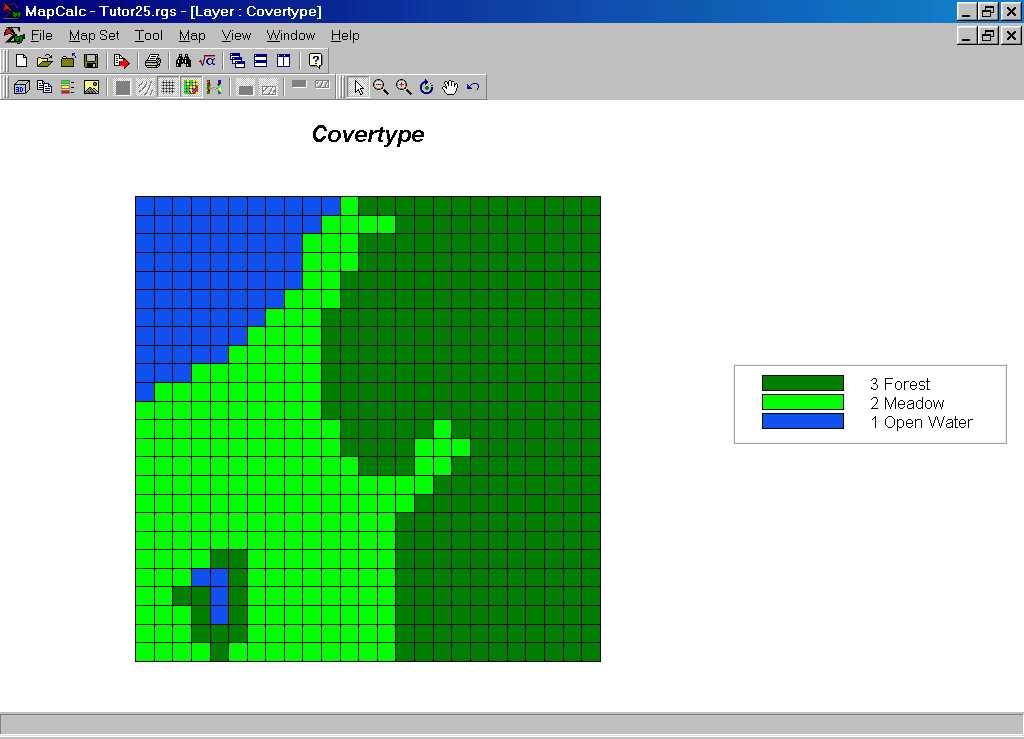 Covertype Map. Notice the narrow appendages of meadow and
the small forest parcel around the pond.
Covertype Map. Notice the narrow appendages of meadow and
the small forest parcel around the pond.
Step 1. The MapCalc operation…
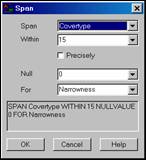
SPAN Covertype WITHIN 15 NULLVALUE 0 FOR Narrowness
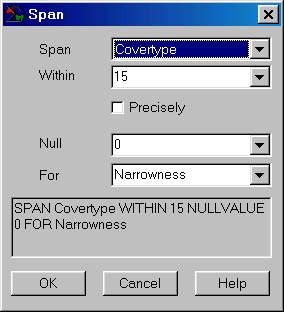
…creates a map of narrowness for all locations within the project area. Narrowness is defined as “the shortest cord connecting opposing edges.” In this case the edges are defined as cover type transitions. The concept of narrowness shouldn’t be confused with that of core area— narrowness identifies the distance between edges; core area identifies distance to the nearest edge.
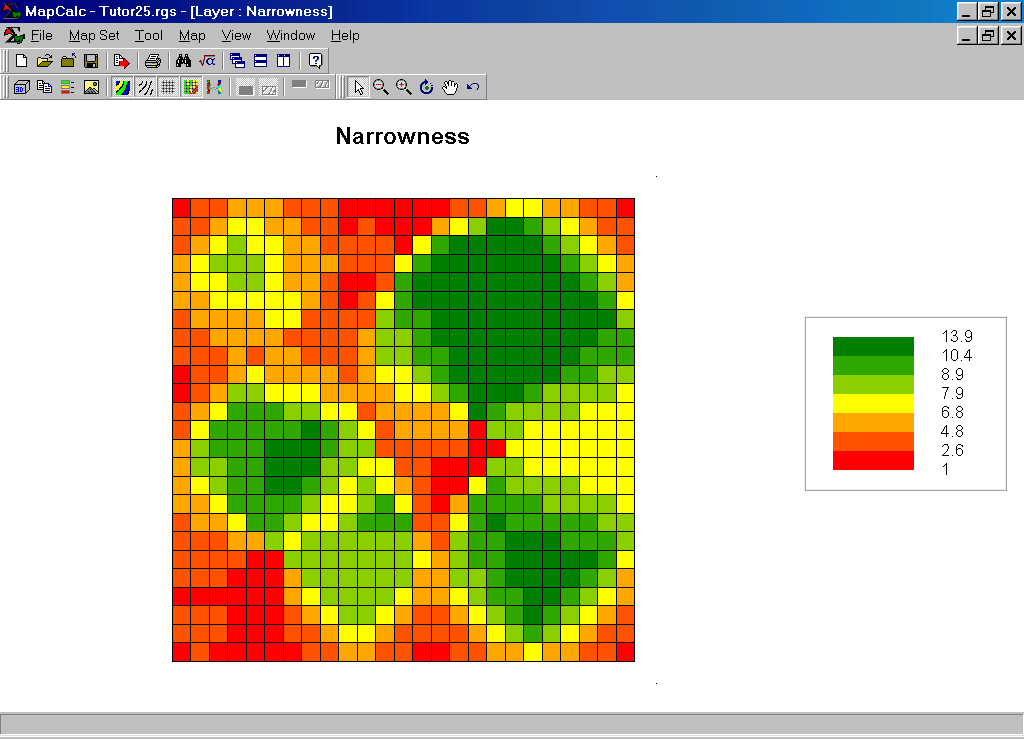 Narrowness Map. The red areas
are very narrow while the green areas are very
open. Note the narrow artifact for the
corners of the map due to the artificial border edge. All project areas should contain an extent
larger than the actual area.
Narrowness Map. The red areas
are very narrow while the green areas are very
open. Note the narrow artifact for the
corners of the map due to the artificial border edge. All project areas should contain an extent
larger than the actual area.
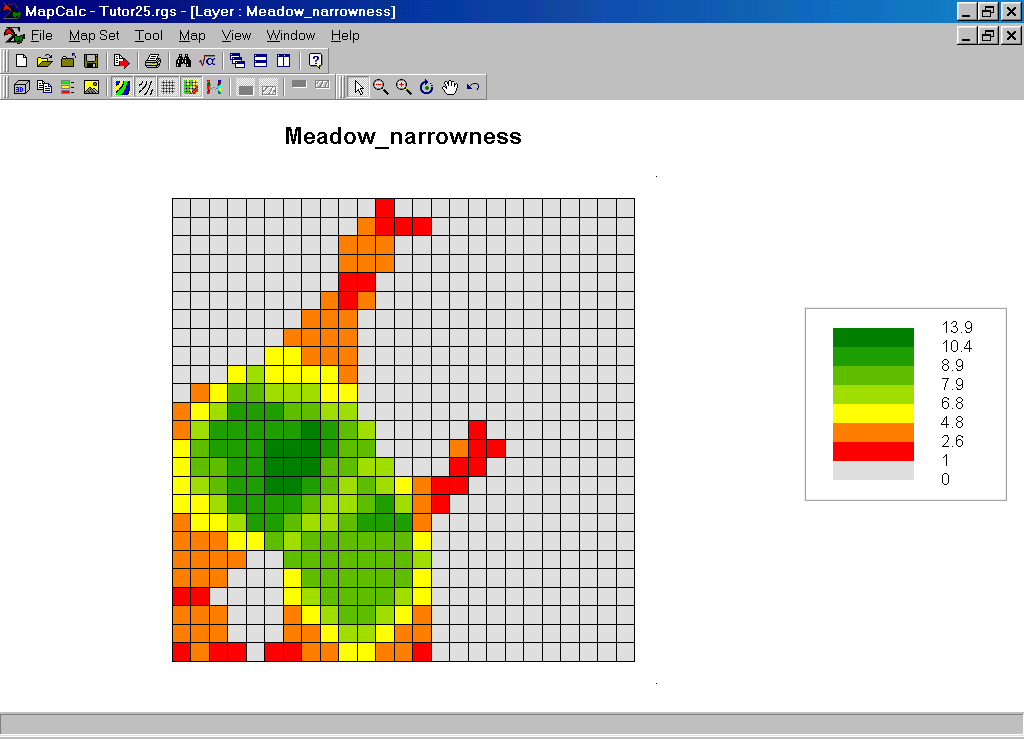 Meadow_narrowness Map.
This map shows the narrowness values for just the meadow parcel.
Meadow_narrowness Map.
This map shows the narrowness values for just the meadow parcel.
Step 2. The MapCalc operation…
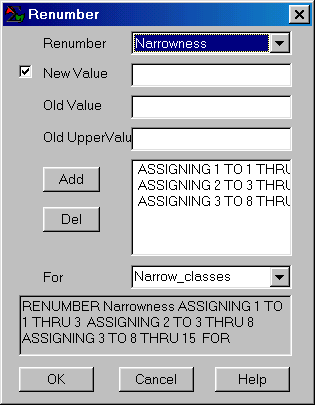 RENUMBER Narrowness ASSIGNING 1 TO 1
THRU 3 ASSIGNING
RENUMBER Narrowness ASSIGNING 1 TO 1
THRU 3 ASSIGNING
…creates a three level classification of narrowness— Narrow (1= 1 to 3 cells), Moderate (2= 3 to 8 cells) and Open (3= 8 to 15).
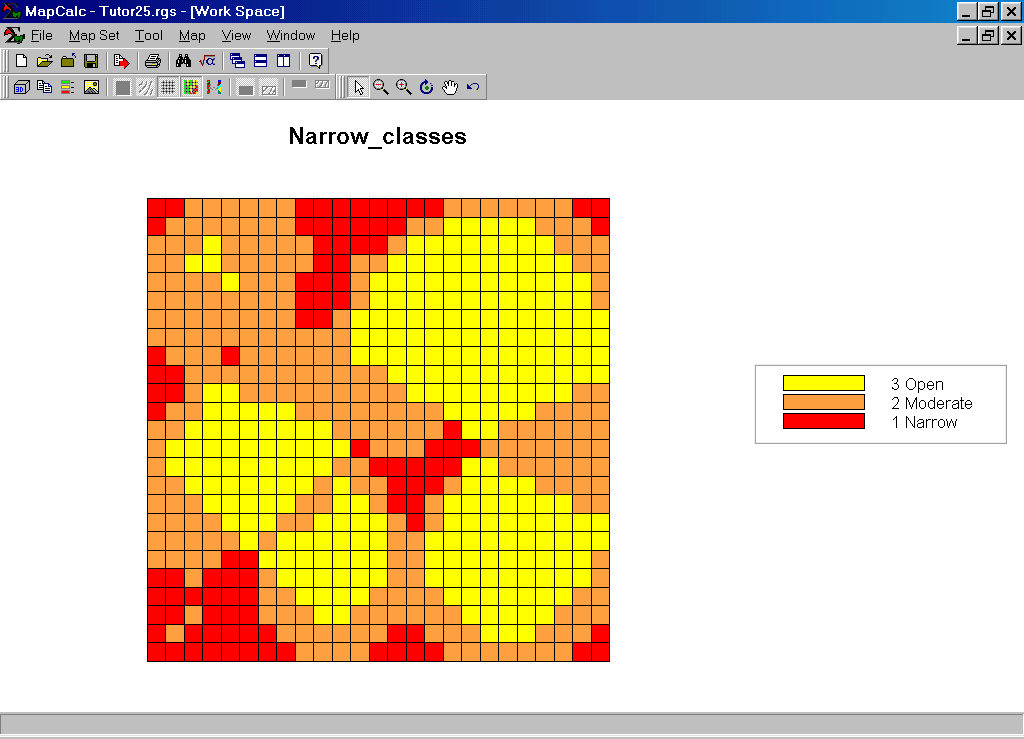 Narrow_classes Map.
Step 3. The MapCalc operation…
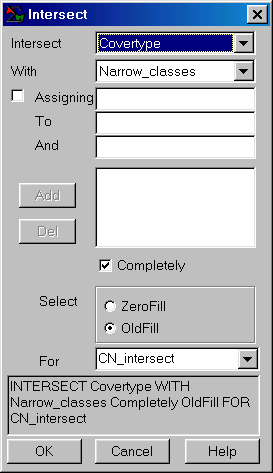 INTERSECT Covertype
WITH Narrow_classes Completely OldFill
FOR CN_intersect
INTERSECT Covertype
WITH Narrow_classes Completely OldFill
FOR CN_intersect
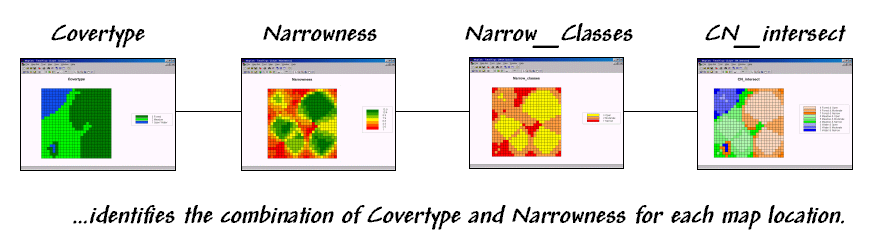
 …creates a map that identifies the
combination of Covertype and Narrowness for each map
location.
…creates a map that identifies the
combination of Covertype and Narrowness for each map
location.
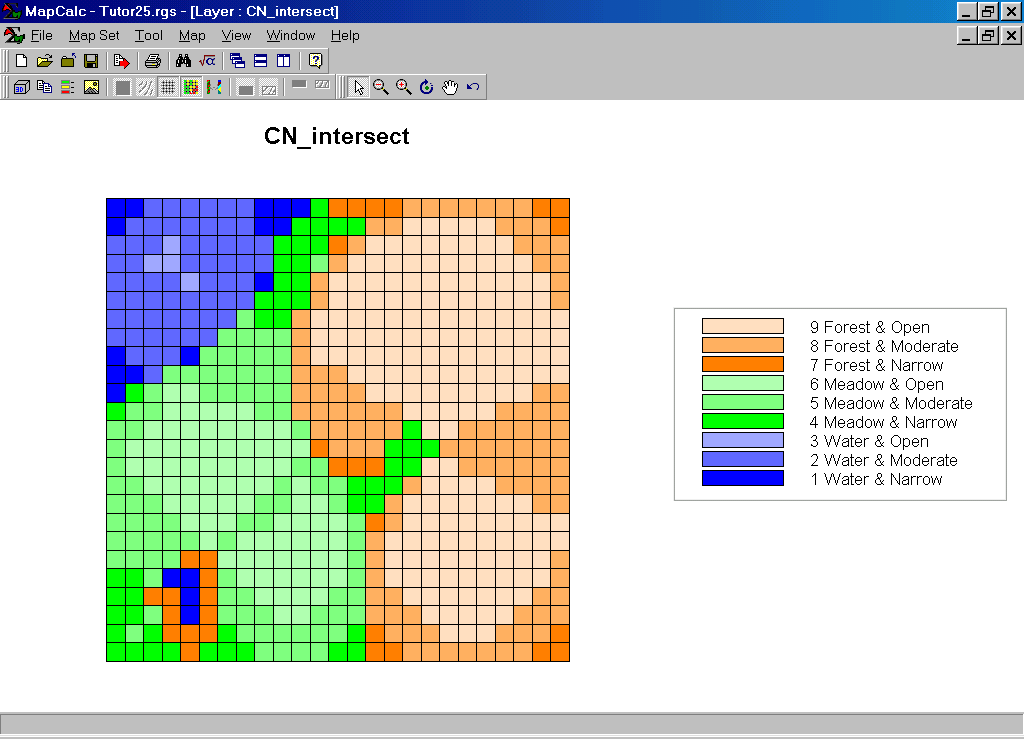
CN_intersect Map. The
blue tones identify the narrowness classes for Water progressing from dark blue
for narrow areas through light blue for open areas; greens identify Meadow
narrowness; and tans identify
Summary. By using the Span (narrowness) and Intersect
(coincidence) operations in MapCalc a wildlife biologist can generate a map
that identifies the cover type and relative narrowness for each grid cell in a
project area. The radio-collar data will
be superimposed on this map to determine the amount of time (by season and time
of day) the animal spends in each of the cover/narrowness classes.