Applying MapCalc Map Analysis Software
Altering the Plot Cube for Different 3-D Views: The three-dimensional display of grid data
effectively communicates continuous map data.
While 3-D plots of elevation are a familiar representation of the terrain,
the display form is very effective for relating the relative responses of other
map variables, such as product sales, visual exposure and pollution
concentrations.
<click here>
for a printer friendly version (.pdf)
Basic Features of the Plot Cube. The plot cube controls the display of three-dimensional surfaces. Its basic components include the cube with ceiling, floor, and grid lines surrounding the surface plot.
Controlling Plot Cube Features. The Plot Cube tab in the Map Properties dialog box (right-click on the plot) is used to set the vertical scale of the map surface and the appearance of the XYZ axes.
 The “Use default scale” checkbox
automatically balances the scaling of the XYZ axes for a visually pleasing
display.
The “Use default scale” checkbox
automatically balances the scaling of the XYZ axes for a visually pleasing
display.


 By explicitly setting the “Min/Max” Z values
the user can control the vertical exaggeration of the surface plot.
By explicitly setting the “Min/Max” Z values
the user can control the vertical exaggeration of the surface plot.


 By setting the Cube Color to the background
color (white) the plot cube is not visible.
By setting the Cube Color to the background
color (white) the plot cube is not visible.
Adjusting 3-D Plot Appearance. The plot cube can be blanked, zoomed and rotated for different views of the map surface.
![]() Navigation tools for display include select,
continuous zoom, area zoom, rotate, pan and reset defaults. They operate by simply
“clicking-and-dragging” the plot for the desired view.
Navigation tools for display include select,
continuous zoom, area zoom, rotate, pan and reset defaults. They operate by simply
“clicking-and-dragging” the plot for the desired view.
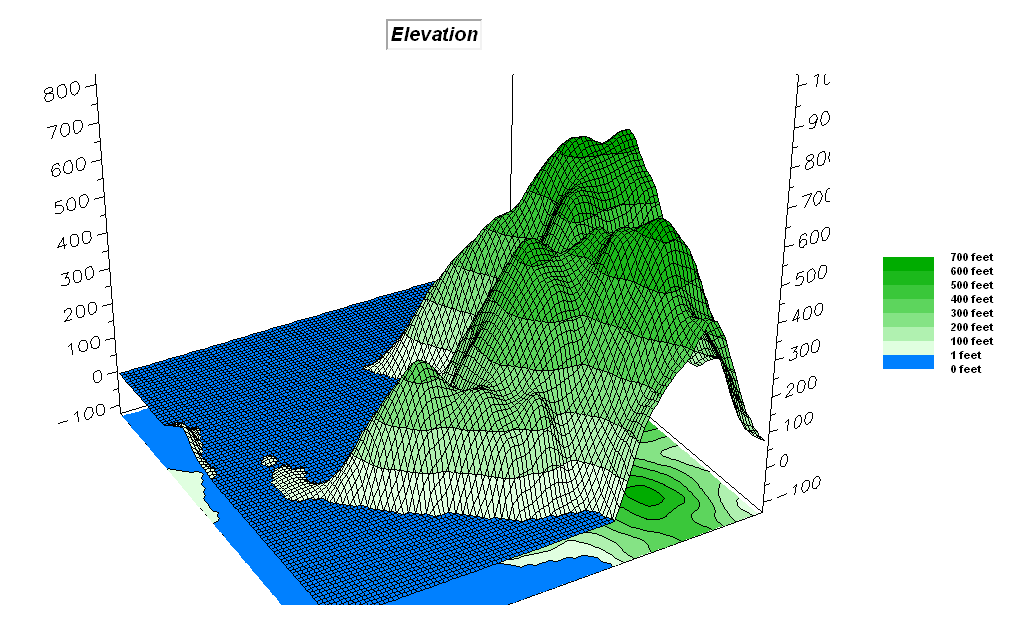
![]() The first figure is an oblique view of the
elevation surface from the southwest.
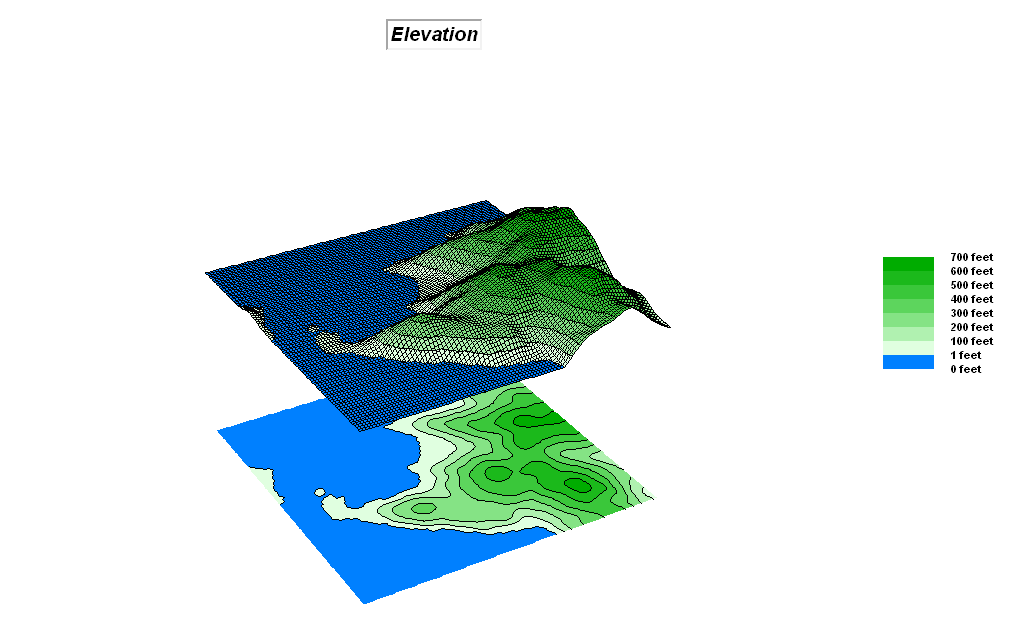
The second figure has rotated the surface for a more vertical view from
the northeast. Note the map value label
for the same location in both views.
The first figure is an oblique view of the
elevation surface from the southwest.
The second figure has rotated the surface for a more vertical view from
the northeast. Note the map value label
for the same location in both views.
![]() Map appearance tools change the look of the
map display as described in the MCdisplay_scenario
example.
Map appearance tools change the look of the
map display as described in the MCdisplay_scenario
example.
Summary. The ability to interactively create 3-D plots of grid data is an important feature of a map analysis package. The displays enable users to conceptualize relationships within mapped data that are difficult to visualize in 2-D contour maps. The ability to simultaneously view 2-D and 3-D renderings provides even more information. Moving the mouse over the surface continuously displays the map values and serves as a link between the graphic representation and the actual map data.