Applying MapCalc Map Analysis Software
Data Inspection and Charting Features: Mapped data is just that—organized sets of
numerical values (data). Effective links
between map displays and map data are critical in understanding spatial
patterns. Summary tables and charts
provide further insight.
<click here>
for a printer friendly version (.pdf)
Data Inspection. Links between map displays and the underlying grid data is important in visualizing spatial patterns within and among maps.
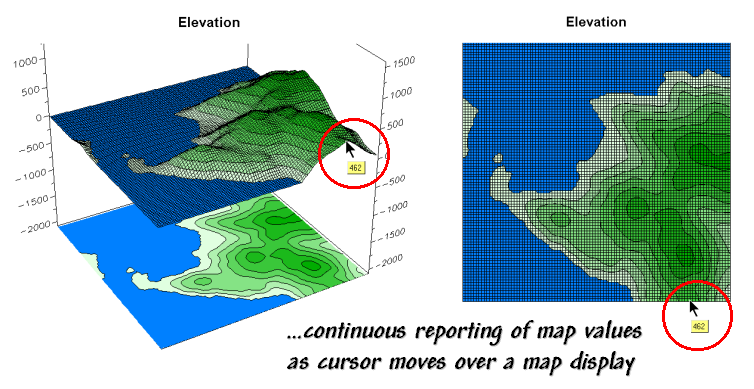 By moving the cursor over a map, a tracking
window continuously updates the value for each location.
By moving the cursor over a map, a tracking
window continuously updates the value for each location.
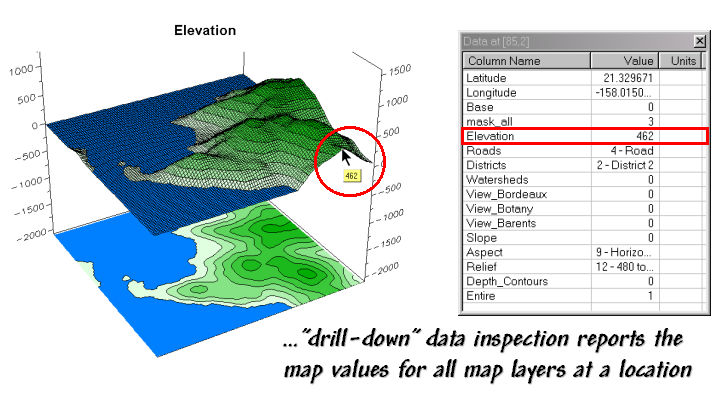 When the Data Inspection tool
is activated the map values for all map layers in the database are continuously
updated in a window as the cursor is moved over a map.
When the Data Inspection tool
is activated the map values for all map layers in the database are continuously
updated in a window as the cursor is moved over a map.
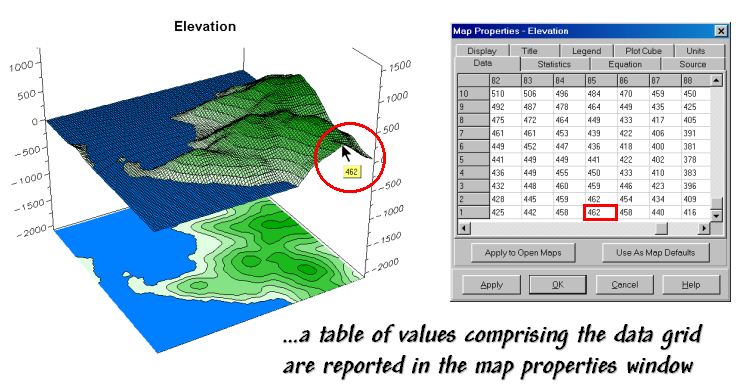 The values defining a map layer are listed in
tabular form under the “Data” tab in the Map Properties
window. Note that the 462-foot elevation
point in the example is located in the data matrix at column 85, row 1.
The values defining a map layer are listed in
tabular form under the “Data” tab in the Map Properties
window. Note that the 462-foot elevation
point in the example is located in the data matrix at column 85, row 1.
Data Summary and Charting. Summary statistics and plots of map data are helpful in generalizing data characteristics.
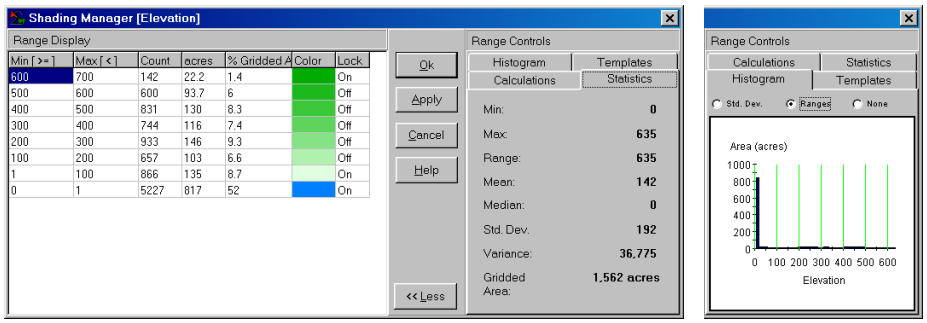 Basic statistics and a histogram of the data
comprising a map are available with the Shading Manager for quick
reference when specifying contour intervals.
The vertical lines in the histogram show the data intervals for the
current map display assignments.
Alternatively, the vertical lines can be set to reflect the standard
deviation intervals.
Basic statistics and a histogram of the data
comprising a map are available with the Shading Manager for quick
reference when specifying contour intervals.
The vertical lines in the histogram show the data intervals for the
current map display assignments.
Alternatively, the vertical lines can be set to reflect the standard
deviation intervals.
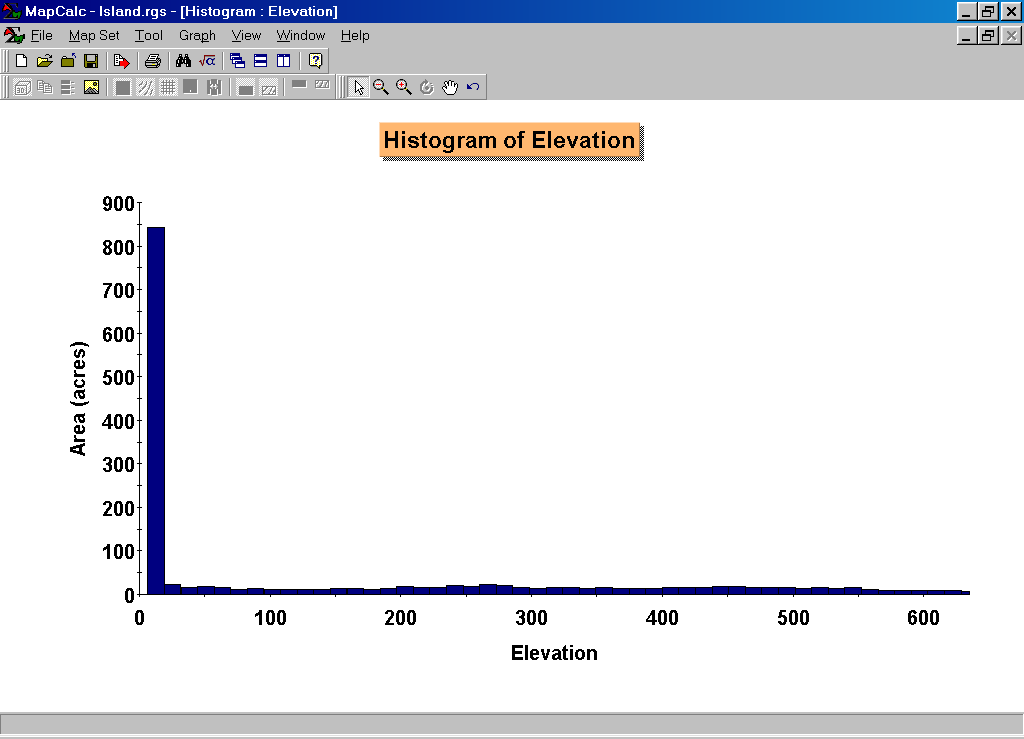 Using the Histogram charting
feature can generate a higher quality plot.
The plot isn’t very interesting because a little over half of the map
area is ocean hence the big spike at 0 elevation dominates the information on
other elevation levels.
Using the Histogram charting
feature can generate a higher quality plot.
The plot isn’t very interesting because a little over half of the map
area is ocean hence the big spike at 0 elevation dominates the information on
other elevation levels.
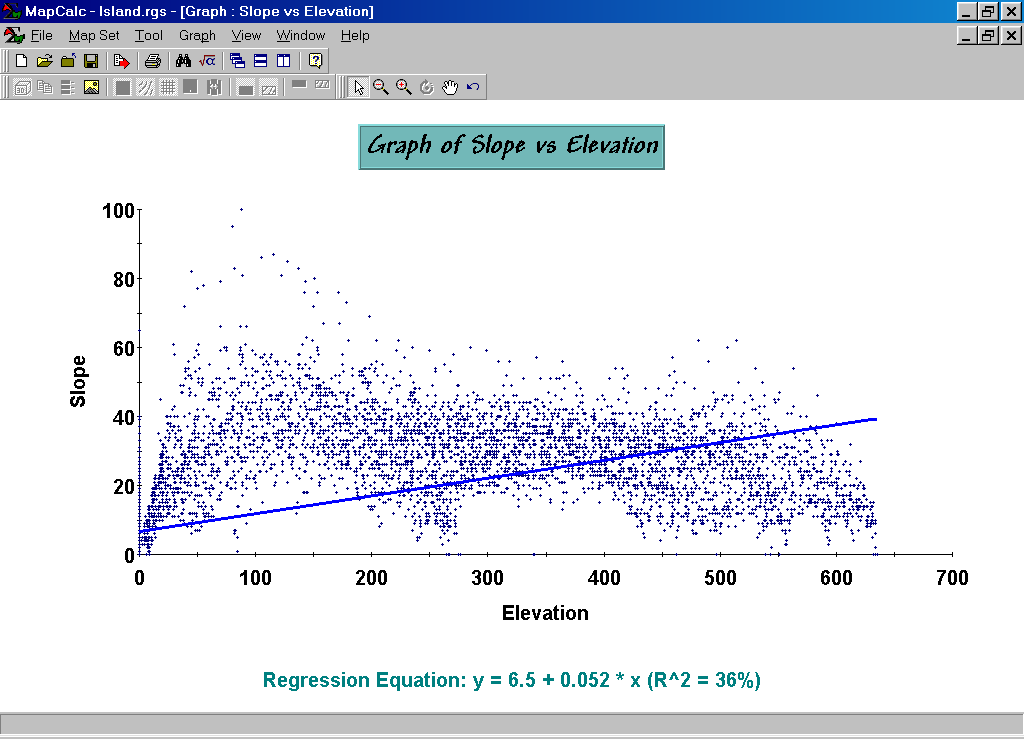 The Scatterplot charting
feature shows the relationship between two maps. Each dot in the plot represents the values on
both maps, termed “joint condition,” for a specific map location. The Regression Equation quantifies the data
pattern and the R-Squared statistic indicates the strength of the relationship.
The Scatterplot charting
feature shows the relationship between two maps. Each dot in the plot represents the values on
both maps, termed “joint condition,” for a specific map location. The Regression Equation quantifies the data
pattern and the R-Squared statistic indicates the strength of the relationship.
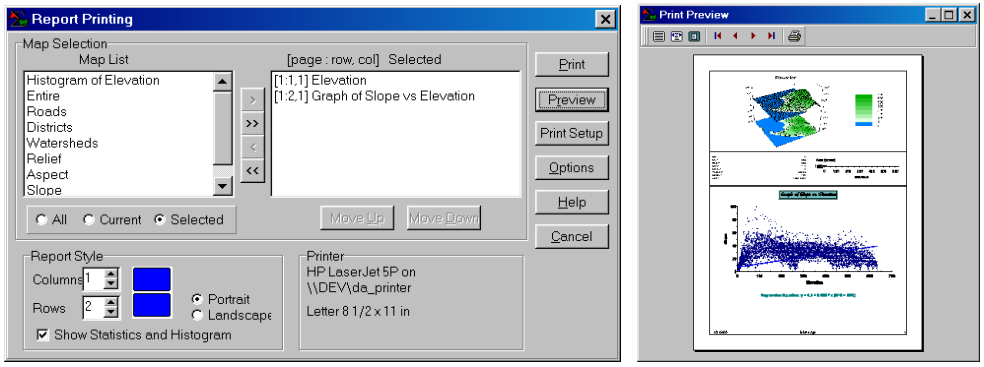 The Report Printing tool
provides a quick and easy way to generate hardcopy printouts of maps and charts. In this example, a 3-D display of Elevation
is combined with basics statistics and a scatterplot of the Elevation and Slope
maps.
The Report Printing tool
provides a quick and easy way to generate hardcopy printouts of maps and charts. In this example, a 3-D display of Elevation
is combined with basics statistics and a scatterplot of the Elevation and Slope
maps.
Summary. MapCalc has several features for inspecting and charting the data underlying the display of a map. Use of these tools is as easy as “point ‘n click.”