Applying MapCalc Map Analysis Software
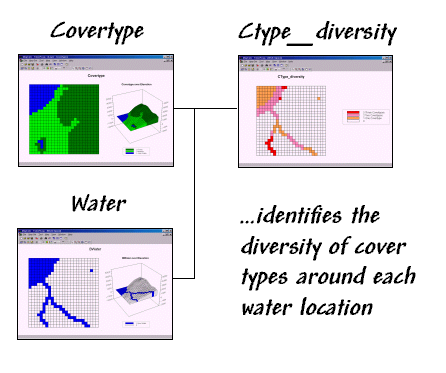
Assessing Cover Type Diversity: A riparian ecologist needs to identify the
cover type diversity around open water features to help identify critical
wildlife habitat.
<click
here> for a printer friendly
version (.pdf)
Processing Flow.
Base Maps. The Base Maps needed include:
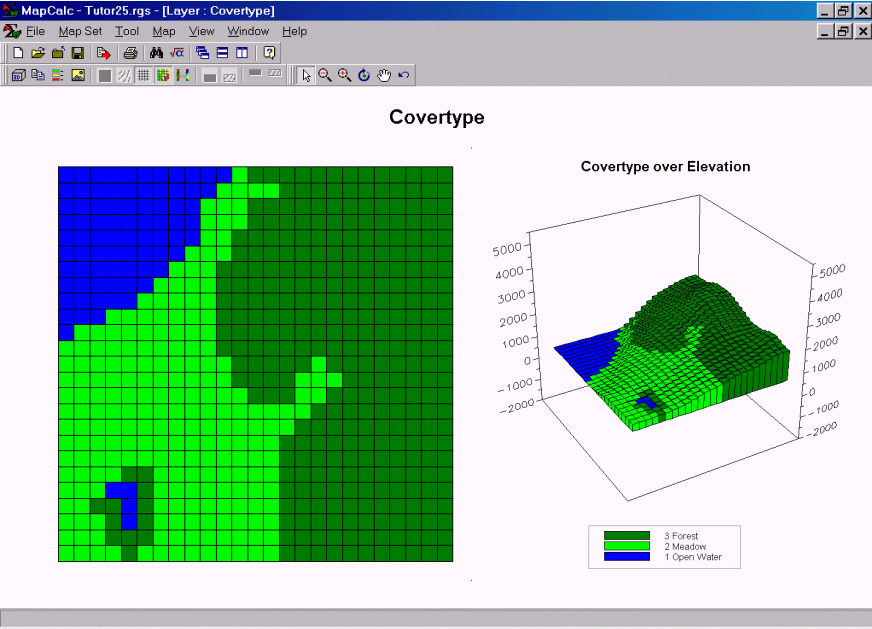 Covertype Map. Each grid location is assigned its dominant
land cover type.
Covertype Map. Each grid location is assigned its dominant
land cover type.
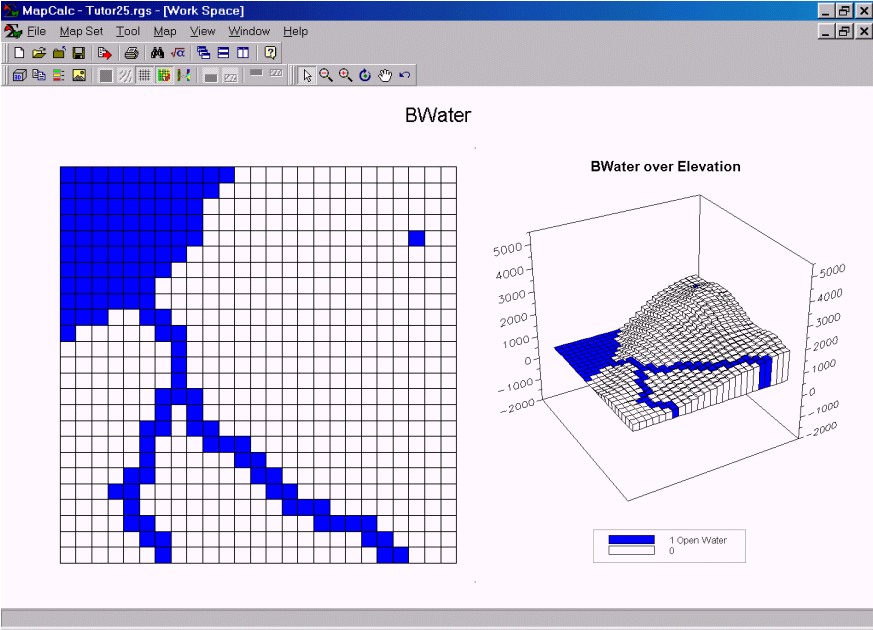 Open Water Map. Each grid location is assigned a 1 if open
water is present. This map was created
by Renumbering the different types of water— RENUMBER Water ASSIGNING 1 TO 1
THRU 100 FOR Bwater.
Open Water Map. Each grid location is assigned a 1 if open
water is present. This map was created
by Renumbering the different types of water— RENUMBER Water ASSIGNING 1 TO 1
THRU 100 FOR Bwater.
Step 1. The MapCalc operation…
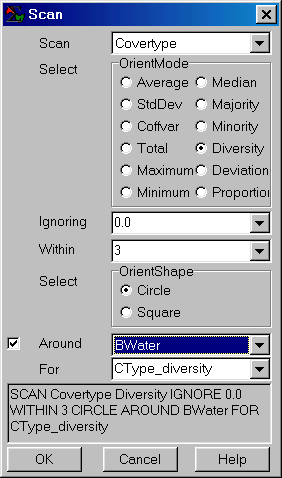 SCAN Covertype Diversity WITHIN 3
AROUND BWater FOR CType_diversity.
SCAN Covertype Diversity WITHIN 3
AROUND BWater FOR CType_diversity.
…creates a cover type diversity map for just the open water locations. The “WITHIN 3” phrase specifies a 3-cell radius (100m/cell * 3 = 300m) for the search window. The “AROUND Water” phrase directs the computer to calculate diversity for just the surface water locations.
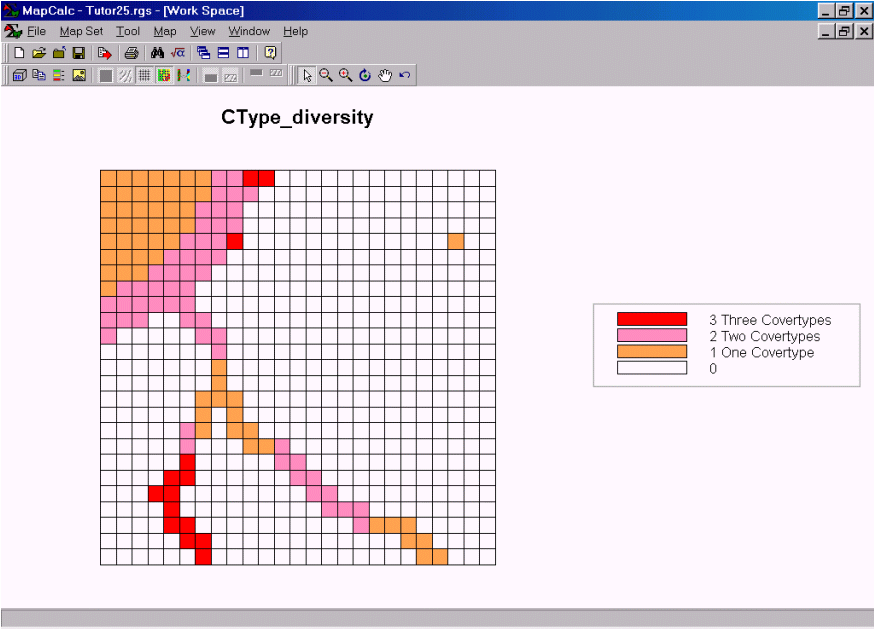 CType_diversity Map. The diversity values indicate the number of
different cover types that occur within a 300-meter circle around
CType_diversity Map. The diversity values indicate the number of
different cover types that occur within a 300-meter circle around
map locations containing surface water. The tan areas indicate minimal diversity (boring; all the same cover type = 1). The red areas indicate locations with maximum cover type diversity (open water, meadow and forest).
Summary. By completing a single dialog box, a riparian ecologist can generate a map of cover type diversity along surface water features. The locations with high diversity provide ideal habitat for many animals as it has water, browse, and shelter within close proximity. The ability to summarize conditions around specified features is not available in vector-based systems.