Applying MapCalc Map Analysis Software
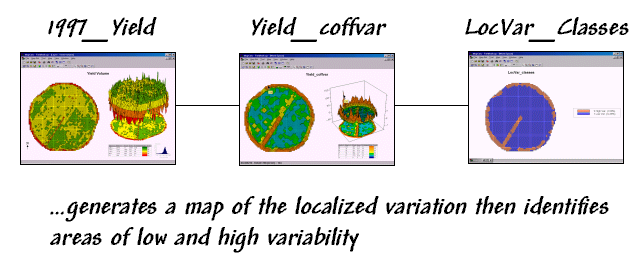
Identifying Areas of Similar Data Patterns
(Clustering): A farmer wants
to identify areas in a field that have similar soil nutrient patterns
(management zones). Instead of managing the
field as one complex unit the intent is to tailor actions, such as
fertilization prescriptions, to the conditions in each data cluster.
<click here> for a
printer friendly version (.pdf)
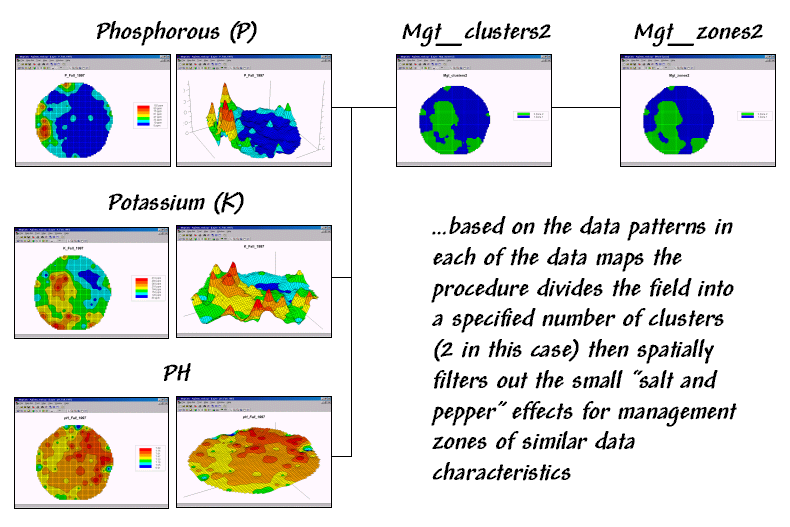
Processing Flow.
Base Maps. The Base Maps needed include:
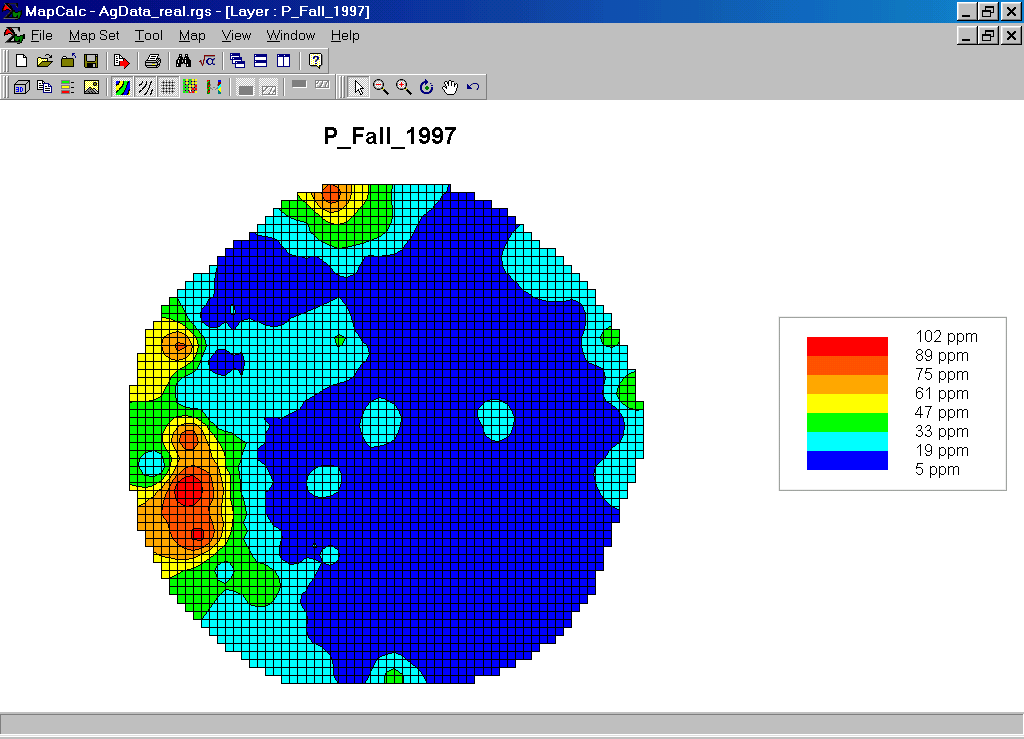
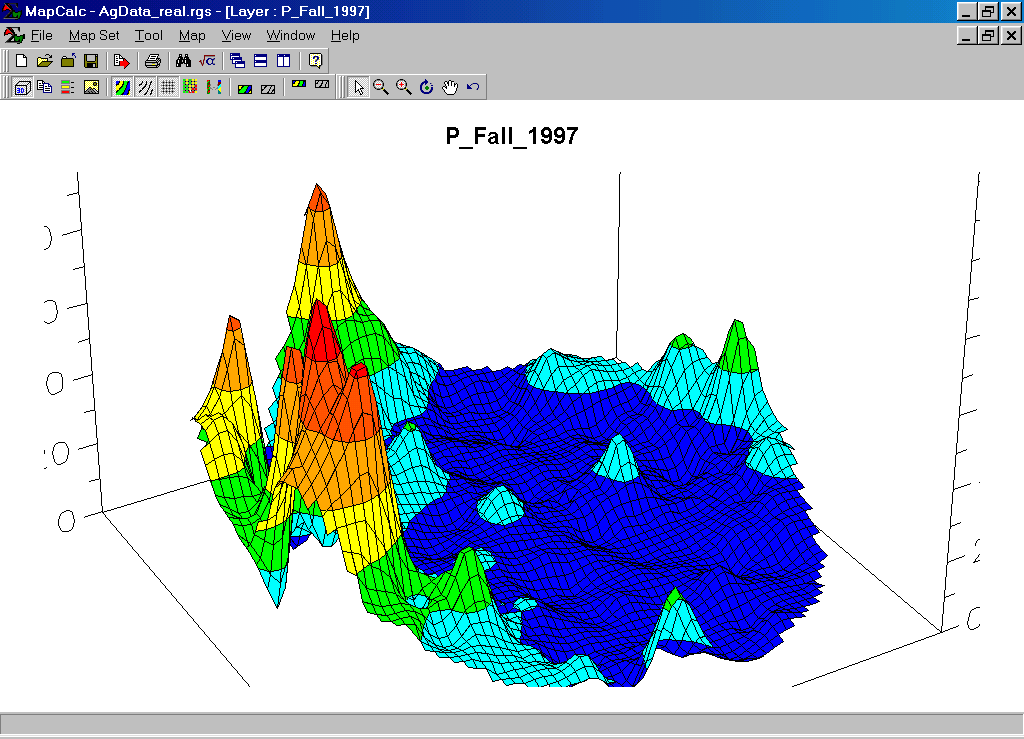
Phosphorus (P) Map. The map values are in “parts per million (ppm).”
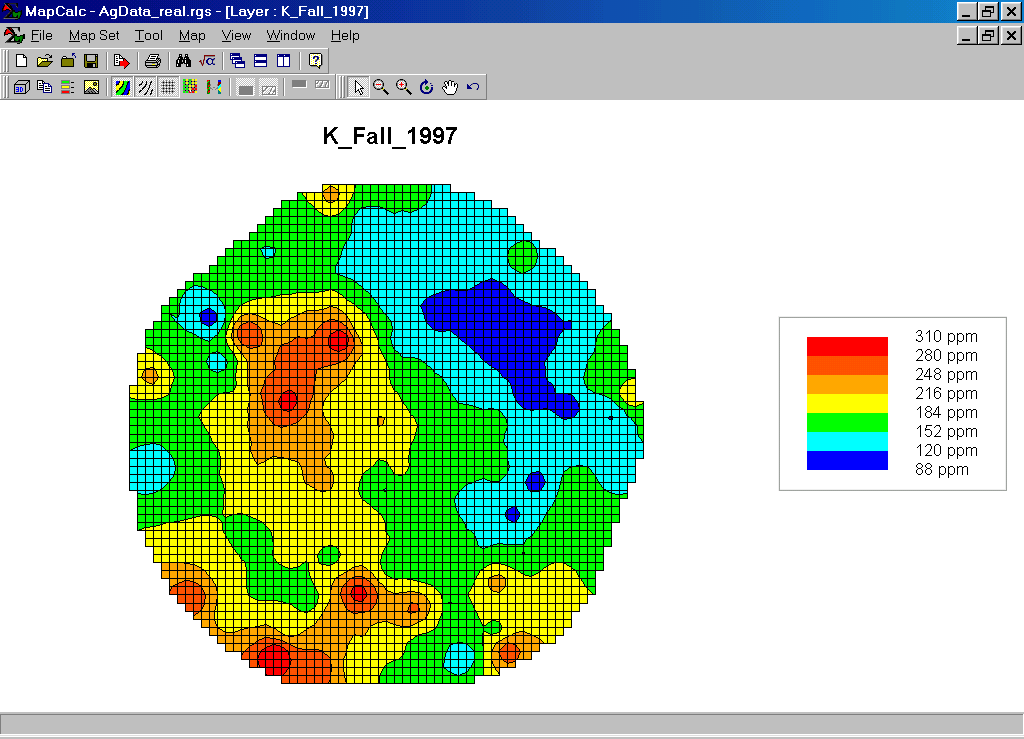
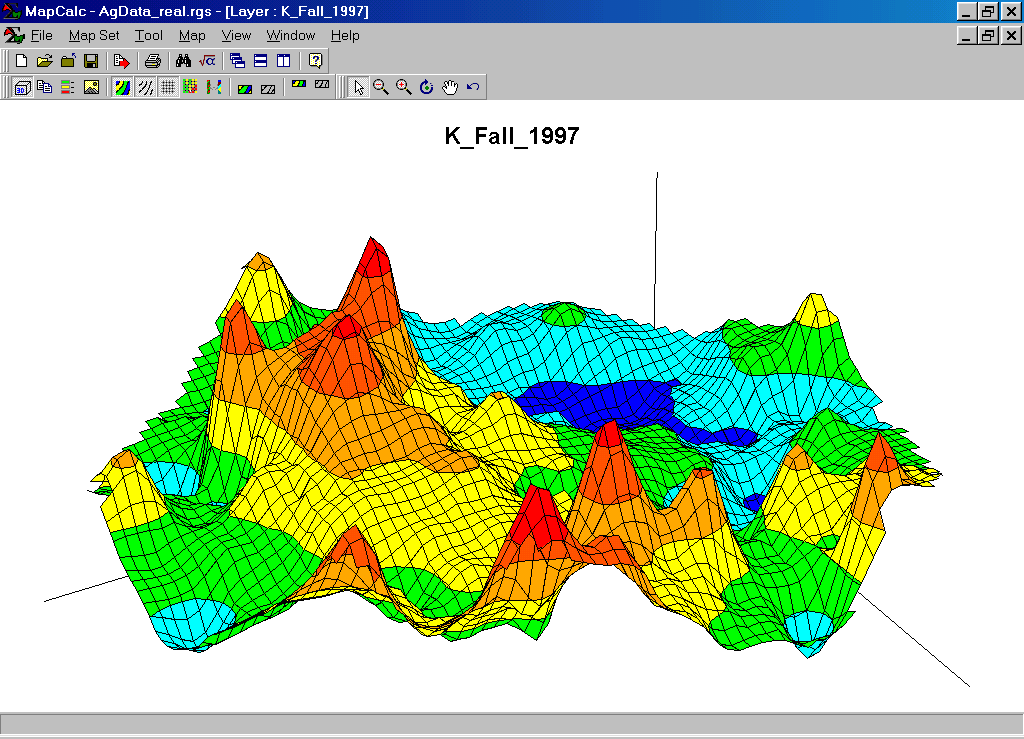
Potassium (K) Map. The map values are in “parts per million (ppm).”
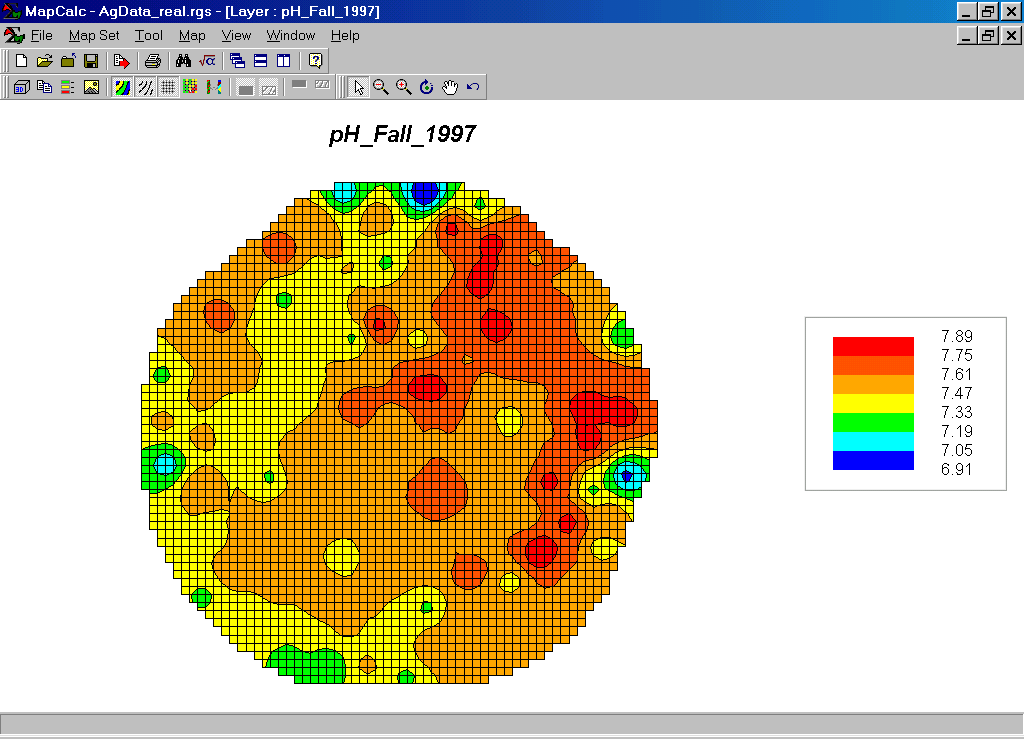
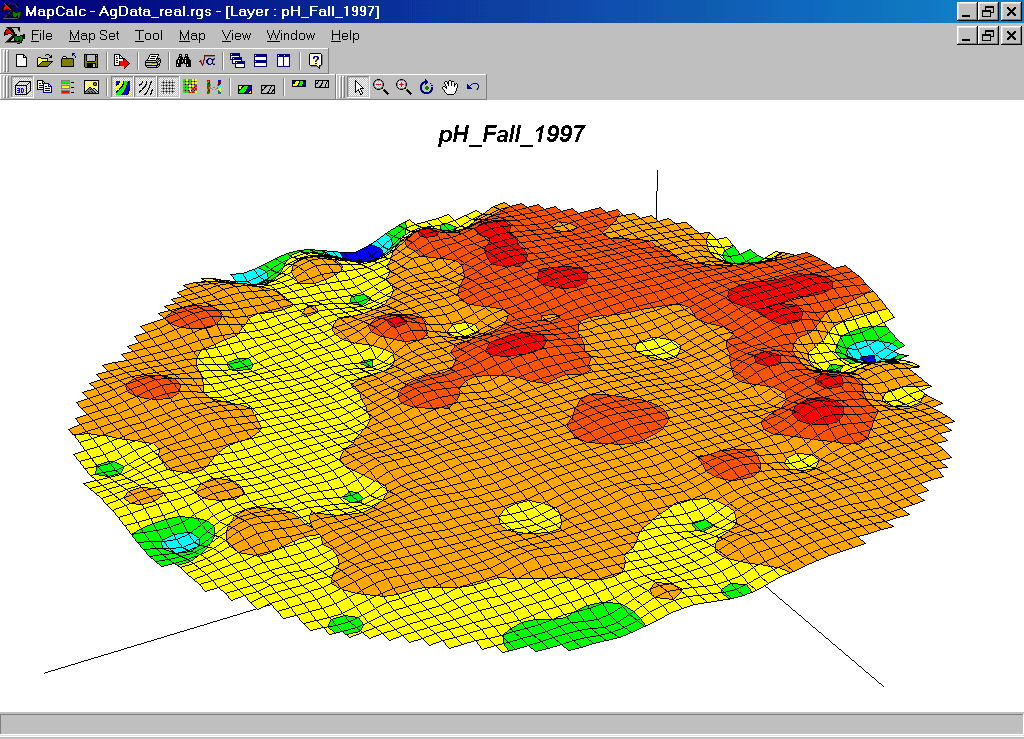
Acidity Map (PH). The map values are in relative units of a logarithmic scale.
Step 1. The MapCalc operation…
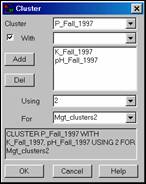 CLUSTER P_Fall_1997 WITH K_Fall_1997,
pH_Fall_1997 USING 2 FOR Mgt_clusters2.
CLUSTER P_Fall_1997 WITH K_Fall_1997,
pH_Fall_1997 USING 2 FOR Mgt_clusters2.
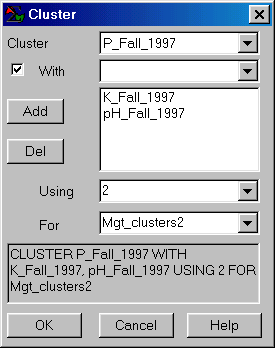
…creates a map of “clusters” that have “as different data patterns as possible” given the set of map layers. If “USING 3” were specified the field would be divided into three clusters. Subdividing into a large number of clusters can result in data groups with minimal differences in their numeric patterns. The “K-Means” clustering algorithm used in this operation is designed to maximize the differences between clusters (inter-cluster variation) while minimizing the differences within each cluster (intra-cluster variation). Keep in mind that distinctly different data patterns may not always result in spatially clumped areas unless there is significant spatial correlation among the map layers.
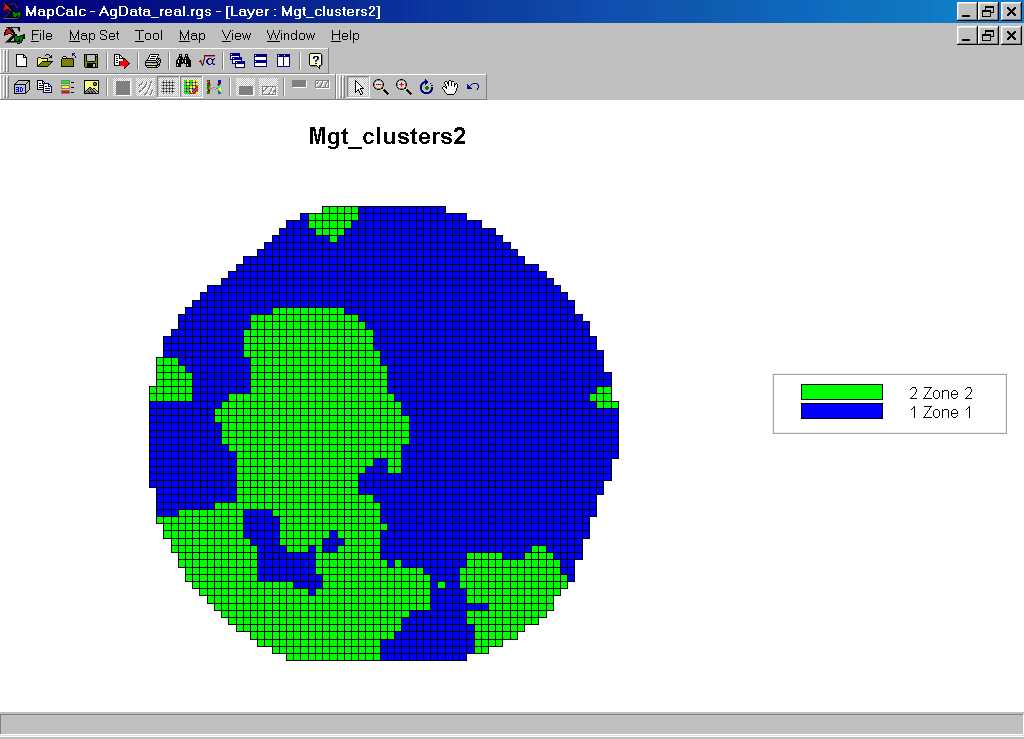 Mgt_clusters2 Map. The “raw” result of classifying the P, K and
PH map layers into two groups.
Mgt_clusters2 Map. The “raw” result of classifying the P, K and
PH map layers into two groups.
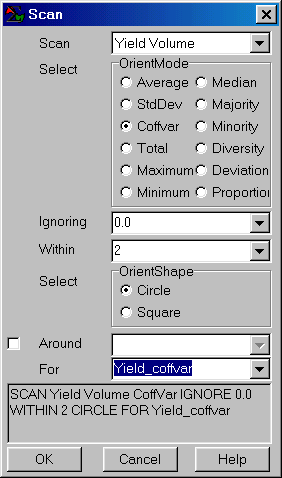
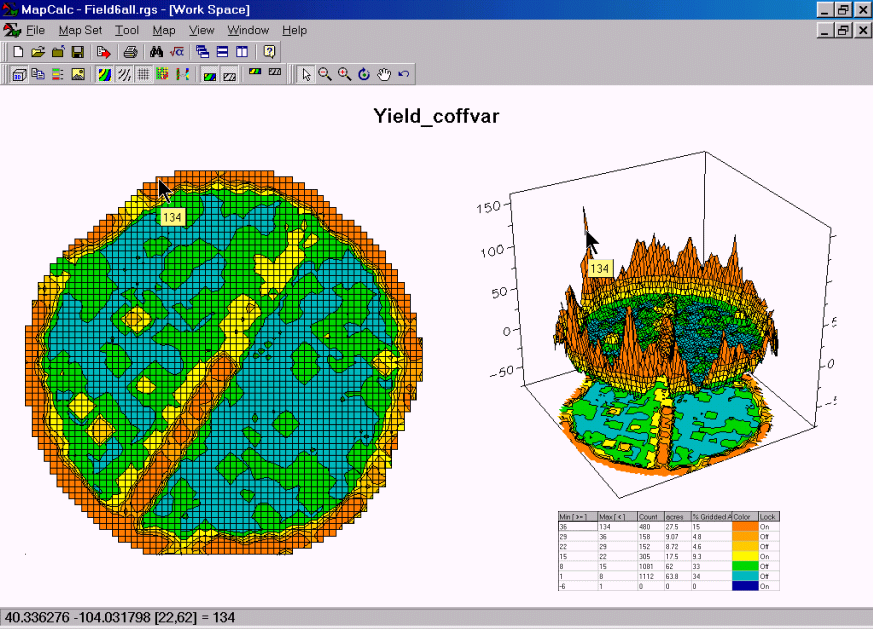
Step 2. The MapCalc operation…
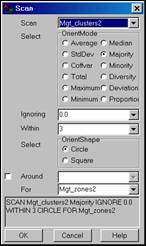 SCAN Mgt_clusters2 Majority WITHIN 3 CIRCLE
FOR Mgt_zones2
SCAN Mgt_clusters2 Majority WITHIN 3 CIRCLE
FOR Mgt_zones2
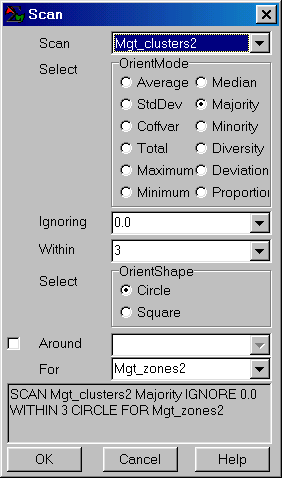
…removes the “salt and pepper” effect of small, isolated clusters and jagged edges that are too small to manage separately. The “Majority WITHIN 3 CIRCLE” phrase instructs the computer to assign the dominant cluster number within a 3-cell radius around each map location. Specifying a larger radius will result in greater generalization (smoothing) of the “raw” cluster assignments.
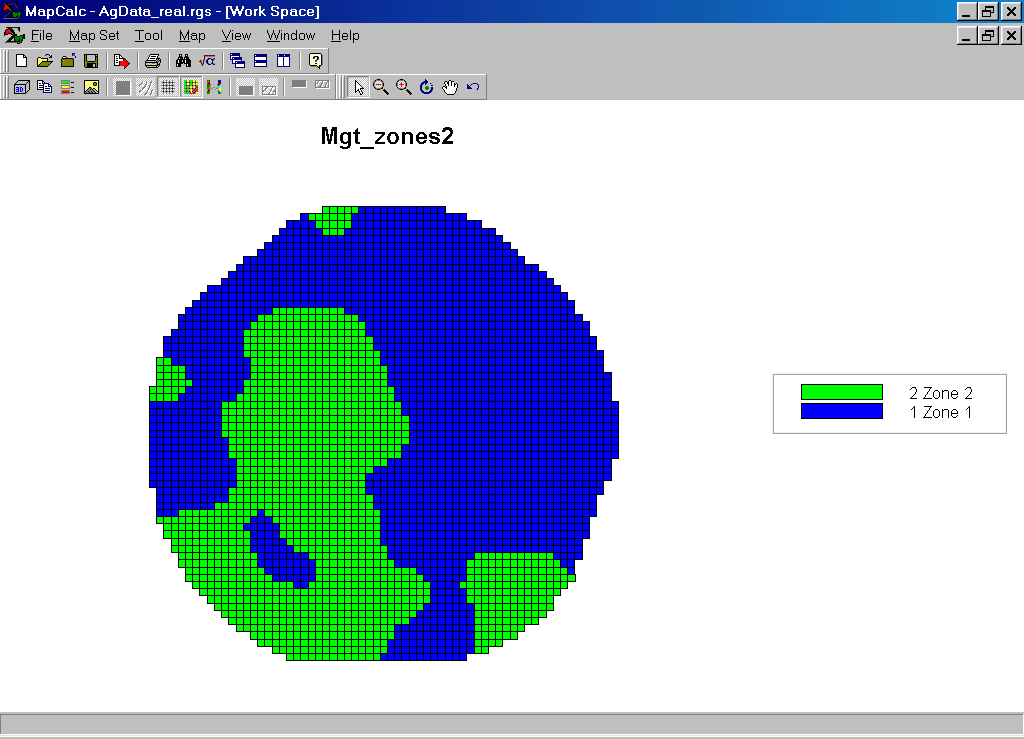 Mgt_zones2 Map. This map identifies areas in the field that
have similar soil nutrient patterns— management zones.
Mgt_zones2 Map. This map identifies areas in the field that
have similar soil nutrient patterns— management zones.
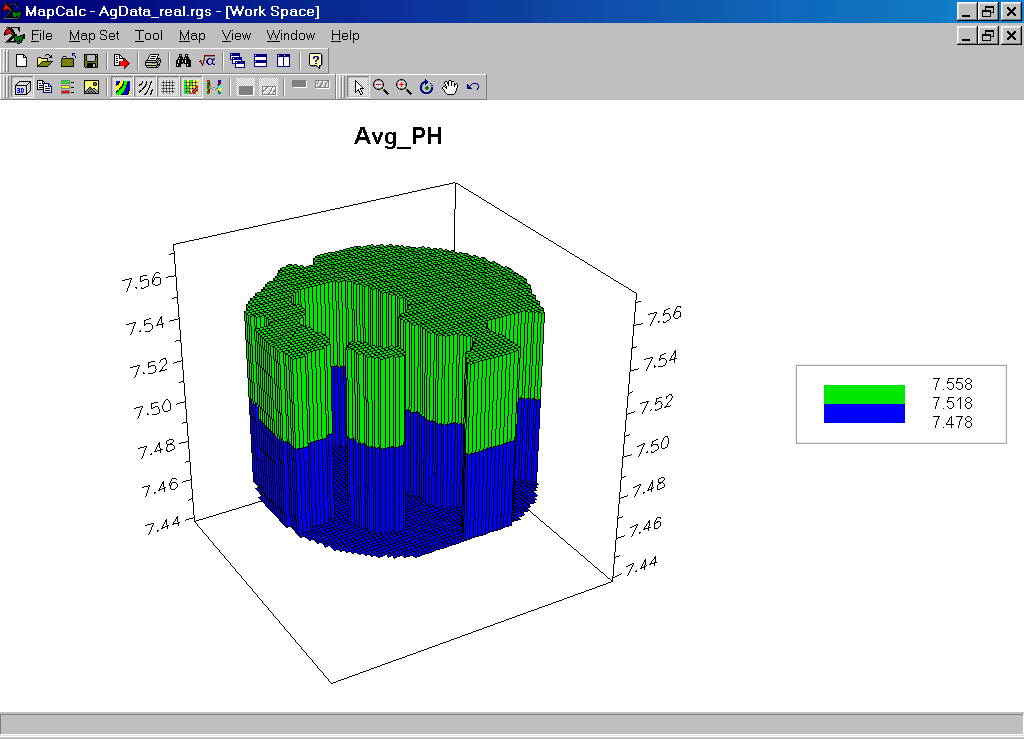
Step 3. The MapCalc operation…
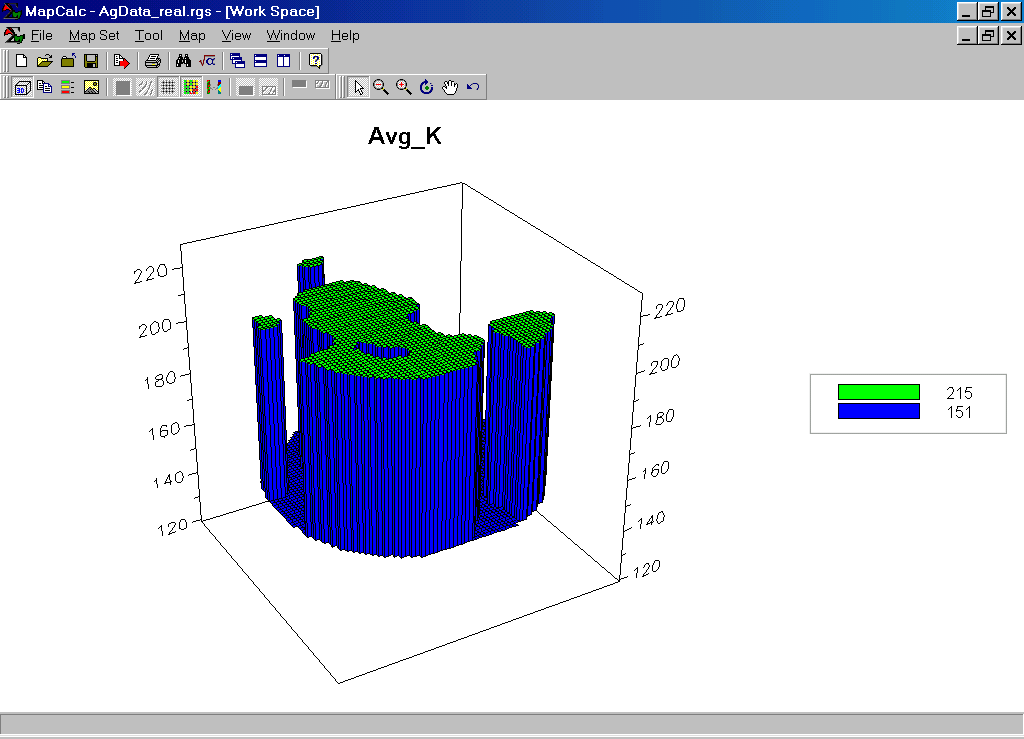
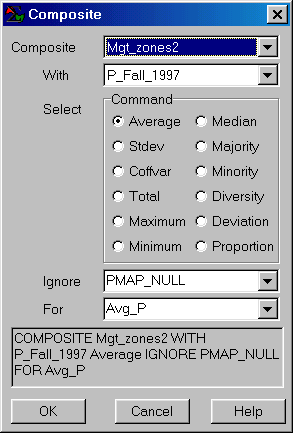 COMPOSITE Mgt_zones2 WITH P_Fall_1997
Average FOR Avg_P
COMPOSITE Mgt_zones2 WITH P_Fall_1997
Average FOR Avg_P
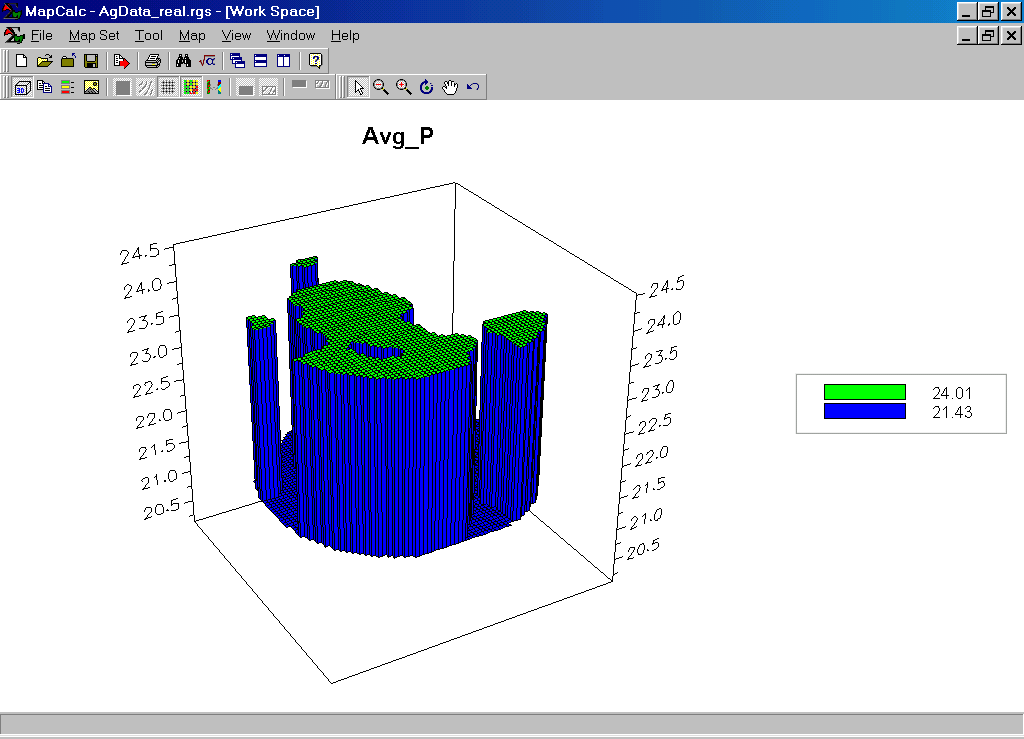
…creates a map of the average Phosphorous occurring in each of the management zones. The operation is repeated for K and PH as reported in the table below.
|
|
|
|
|
Zone 1 average P = 21.43 Zone 2 average P = 24.01 |
Zone 1 average K = 151Zone 2 average K = 215 |
Zone 1 average PH = 7.478Zone 2 average PH = 7.558 |
The average values for P, K, and PH can be used to “tailor” different management actions for the two zones. In practice, increased costs of identifying and managing separate management zones must be offset by cost savings, increased production and/or environmental benefits.
Summary. The “Cluster” operation in MapCalc identifies areas that have similar data patterns. For a farmer, the areas translate to management zones with similar crop production factors, such as P, K, and PH. The same technique is useful in a wide range of other disciplines— a resource manager can identify clusters of similar terrain and habitat conditions; a marketer can identify clusters of similar demographic and access conditions.