Oslo
Presentation materials
Geotechnology
in Transition: Evolution, Current Practice, Trends and Future
Directions that are Moving Us Beyond Mapping
Geospatial Workshop for the City of Oslo,
Norway – September 2, 2010
Presentation
by Joseph
K. Berry
 <click here> for a one-page handout
describing the presentation (.pdf)
<click here> for a one-page handout
describing the presentation (.pdf)
\Oslo_2010 …create this folder, right-click on the file
below, then select “Save target as…” to download the following file into the
folder:
·
Oslo_2010.ppt – PowerPoint slide
set
\Oslo_2010\Links
…create this subfolder, right-click on a files below one at a time, select
“Save target as…” to download the following files into the subfolder:
·
MC_slope_drain.exe –
(7.3MB) a hyperlinked self-extracting video demonstrating calculation of slope
and flow; accessed from slide #5
·
VBuff2.ppt – (.5MB) a nested
PowerPoint animation showing the calculation of effective proximity to water
(erosion potential); accessed from slide #12
·
3Dfire.avi – (6MB) a video of animated
wildfire propagation; accessed from slide #18
·
CartoPac.avi – (27MB) a video
demonstrating a field data collection device; accessed from slide #18
·
GE_EstesPark_photos.avi –
(34MB) a video demonstrating geo-tagged photos in Google Earth; accessed from
slide #18
·
PDL_demo.avi – (60MB) a video
demonstrating “pliable data layer” visualization; accessed from slide #18
·
VR_CopperMT.avi –
(50MB) a video demonstrating a “fly-by” visualization: accessed from slide #18
 …the
hyperlinked files MUST be in a subfolder named …\Links under the folder containing the presentation PowerPoint.
…the
hyperlinked files MUST be in a subfolder named …\Links under the folder containing the presentation PowerPoint.
___________________________________________
 Execute the PowerPoint slide set. Most of the slides have “timed animation”
that automatically displays sequenced portions of a slide; mouse-click or press
the down arrow to advance after a pause, or move to the next slide. To access the linked demos in slides number 5 and 18, you need to mouse-click where it
says <click>. (Note: the \Links folder must be under whatever folder
contains the PowerPoint file)
Execute the PowerPoint slide set. Most of the slides have “timed animation”
that automatically displays sequenced portions of a slide; mouse-click or press
the down arrow to advance after a pause, or move to the next slide. To access the linked demos in slides number 5 and 18, you need to mouse-click where it
says <click>. (Note: the \Links folder must be under whatever folder
contains the PowerPoint file)
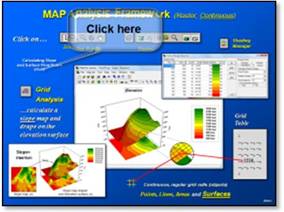 …slide 5’s demo of calculating Slop and Flow
maps used in discussion of the Erosion Potential model (variable-width buffers)
that follows.
…slide 5’s demo of calculating Slop and Flow
maps used in discussion of the Erosion Potential model (variable-width buffers)
that follows.
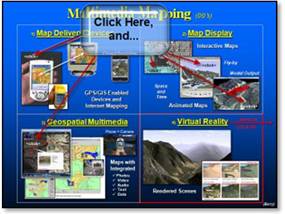 …slide 18’s five links to demos of Multimedia Mapping
…purposely showing “early” efforts (circa 2000) with reference to how today
many of these capabilities are now fairly commonplace and have launched whole
new industries, such as spatially-based crowd sourcing and automatically
geo-tagged photos.
…slide 18’s five links to demos of Multimedia Mapping
…purposely showing “early” efforts (circa 2000) with reference to how today
many of these capabilities are now fairly commonplace and have launched whole
new industries, such as spatially-based crowd sourcing and automatically
geo-tagged photos.