Data Analysis Considerations
and Procedures
for Site-Specific Crop
Management
by Joseph K. Berry1
Click <here> to
view the complete online slide set and notes accompanying this topic.

www.agriculture.com
…Online articles and active discussion
forum on technology
________________________________
Part 2 – Identifying Spatial Relationships in Agricultural Data
 Mapping
yield, soil, terrain and other conditions is becoming commonplace on many
farms. The maps help producers
visualize the variation in their fields, but rarely analyzed to their full
potential. Emerging data analysis
techniques extend graphic interpretation to data analysis and provide insight
into important relationships within and among the mapped data. This two-part @gInnovator Online
presentation describes a series of grid-based analysis techniques designed to
highlight unusual areas in a field, identify significant differences between
maps and develop important relationships between one map, such as yield, and
other maps, such as soil conditions and micro-terrain. A case study will serve to illustrate the
considerations and procedures used in site-specific management of agricultural
crops.
Mapping
yield, soil, terrain and other conditions is becoming commonplace on many
farms. The maps help producers
visualize the variation in their fields, but rarely analyzed to their full
potential. Emerging data analysis
techniques extend graphic interpretation to data analysis and provide insight
into important relationships within and among the mapped data. This two-part @gInnovator Online
presentation describes a series of grid-based analysis techniques designed to
highlight unusual areas in a field, identify significant differences between
maps and develop important relationships between one map, such as yield, and
other maps, such as soil conditions and micro-terrain. A case study will serve to illustrate the
considerations and procedures used in site-specific management of agricultural
crops.
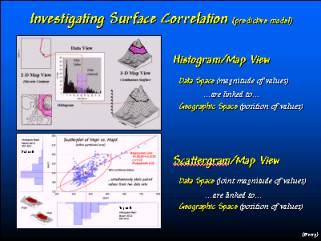 Mapped data is graphically summarized by a
“histogram” plot that depicts the number of grid cells (Y axis) having values
that fall within small intervals of the data range (X axis). 2D and 3D displays of the data show the
precise geographic location for each data value. A “scattergram” plots the data values in two maps layers—sort of
a two histograms at once—and graphically shows the correlation between the
maps. The pattern of points in a
scattergram can be mathematically summarized into a prediction equation.
Mapped data is graphically summarized by a
“histogram” plot that depicts the number of grid cells (Y axis) having values
that fall within small intervals of the data range (X axis). 2D and 3D displays of the data show the
precise geographic location for each data value. A “scattergram” plots the data values in two maps layers—sort of
a two histograms at once—and graphically shows the correlation between the
maps. The pattern of points in a
scattergram can be mathematically summarized into a prediction equation.
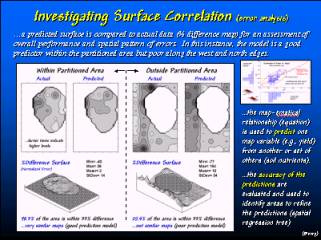 Once a prediction equation is known it can
be used to estimate what one variable might be given another (or set of
others). In this example, the amount of
phosphorous in the topsoil was used to predict the amount in the sub-soil. While the predictions were very good for the
NE-central portion of the field (left-side of the main figure), they were not
good for the rest of the field.
However, the spatial pattern of the error (lower-right of the main
figure) shows that the model over predicts along the west side of the field and
tends to under predict along the northern side. This spatial distribution of error is used to reconstruct
equations for two areas. Use of the
three prediction equations within the appropriate areas creates good
predictions across the entire field.
This iterative procedure is termed “spatial trees” and utilizes the
spatial information within data sets.
Once a prediction equation is known it can
be used to estimate what one variable might be given another (or set of
others). In this example, the amount of
phosphorous in the topsoil was used to predict the amount in the sub-soil. While the predictions were very good for the
NE-central portion of the field (left-side of the main figure), they were not
good for the rest of the field.
However, the spatial pattern of the error (lower-right of the main
figure) shows that the model over predicts along the west side of the field and
tends to under predict along the northern side. This spatial distribution of error is used to reconstruct
equations for two areas. Use of the
three prediction equations within the appropriate areas creates good
predictions across the entire field.
This iterative procedure is termed “spatial trees” and utilizes the
spatial information within data sets.
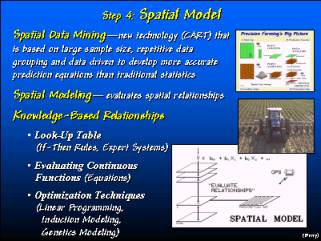 If good prediction equations can be
developed (i.e., yield predictions based on soil nutrients, terrain, etc) they
can be used to determine the optimal combination of factors. For example, early spring soil samples can
be used to create maps of current nutrient levels that are used to “solve” the
yield equation for each grid cell—this establishes the “no action” yield
level. An optimization technique can be
used to iteratively add more nutrients until the cost of the fertilizer program
approaches or equals the marginal revenue of the increased yield. In essence, the analysis is similar to
having a comprehensive set of research trials for all of the unique conditions
within the field. While this “spatial
data mining” approach to precision farming is in its infancy, the approach
forms the basis for many geo-business applications in other disciplines.
If good prediction equations can be
developed (i.e., yield predictions based on soil nutrients, terrain, etc) they
can be used to determine the optimal combination of factors. For example, early spring soil samples can
be used to create maps of current nutrient levels that are used to “solve” the
yield equation for each grid cell—this establishes the “no action” yield
level. An optimization technique can be
used to iteratively add more nutrients until the cost of the fertilizer program
approaches or equals the marginal revenue of the increased yield. In essence, the analysis is similar to
having a comprehensive set of research trials for all of the unique conditions
within the field. While this “spatial
data mining” approach to precision farming is in its infancy, the approach
forms the basis for many geo-business applications in other disciplines.
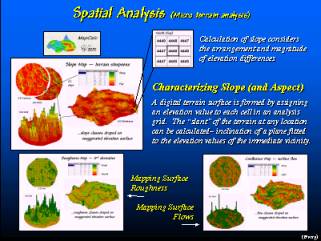 Terrain is an important factor affecting
crop production. Spatial analysis
techniques are available to determine slope, orientation (aspect)roughness and
surface flows.
Terrain is an important factor affecting
crop production. Spatial analysis
techniques are available to determine slope, orientation (aspect)roughness and
surface flows.
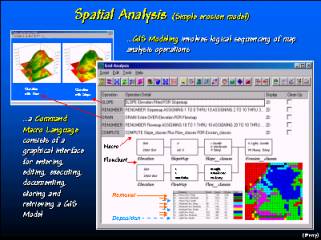 Sequencing several spatial analysis
operations forms a GIS model. This
model, consisting of five commands generates an erosion potential map based on
the relative slope and surface flow conditions at each grid location—steep
areas with lots of uphill locations contributing water is denoted as high
erosion potential.
Sequencing several spatial analysis
operations forms a GIS model. This
model, consisting of five commands generates an erosion potential map based on
the relative slope and surface flow conditions at each grid location—steep
areas with lots of uphill locations contributing water is denoted as high
erosion potential.
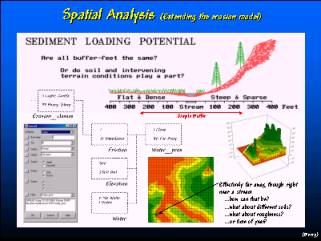 The erosion potential model can be extended
to determine potential for sediment loading.
This model considers the intervening erosion potential of uphill
locations to establish a variable-width buffer around sensitive streams. GIS data and spatial analysis techniques are
increasingly being used to add real-world considerations to environmental
policy and regulations.
The erosion potential model can be extended
to determine potential for sediment loading.
This model considers the intervening erosion potential of uphill
locations to establish a variable-width buffer around sensitive streams. GIS data and spatial analysis techniques are
increasingly being used to add real-world considerations to environmental
policy and regulations.
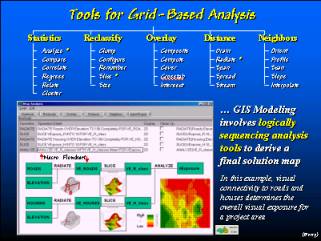 The grid-based analysis “toolbox” provides a
new perspective on research and management in any land-based discipline. Agriculture’s ties to the land invariably
ties it to this new technology. While
maps and cartographic processing isn’t part of crop production’s legacy, its
future is part of the spatial revolution.
The grid-based analysis “toolbox” provides a
new perspective on research and management in any land-based discipline. Agriculture’s ties to the land invariably
ties it to this new technology. While
maps and cartographic processing isn’t part of crop production’s legacy, its
future is part of the spatial revolution.
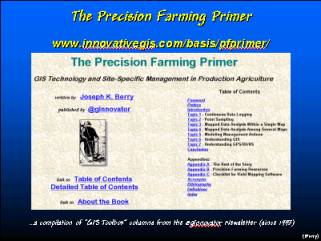 For more information on the topics discussed
in this presentation see http://www.innovativegis.com/basis/pfprimer/
for an online text sponsored by @gInnovator.
For more information on the topics discussed
in this presentation see http://www.innovativegis.com/basis/pfprimer/
for an online text sponsored by @gInnovator.
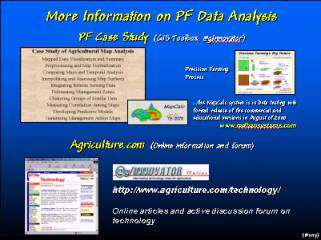 A case study of data analysis in precision
farming will be apprearing in future issues of the @gInnovator Newsletter, For general information and an active
discussion forum on precision farming see http://www.agriculture.com/technology/.
A case study of data analysis in precision
farming will be apprearing in future issues of the @gInnovator Newsletter, For general information and an active
discussion forum on precision farming see http://www.agriculture.com/technology/.
__________________
These @gInnovator Online materials are based on an invited presentation for the Agriculture Discipline Forum, MidAmerica GIS Symposium on “Strengthening theGrowing Geodata Community,” Osage Beach, Missouri, May 14-18, 2000.
Data Analysis Considerations and Procedures for Site-Specific Crop Management
 1Joseph
K. Berry, Columnist for @gInnovator Newsletter, Meredith Publishing
1Joseph
K. Berry, Columnist for @gInnovator Newsletter, Meredith Publishing
![]() President, Berry and
Associates // Spatial Information Systems
President, Berry and
Associates // Spatial Information Systems
 2000 South College Avenue,
Suite 300, Fort Collins, CO 80525
2000 South College Avenue,
Suite 300, Fort Collins, CO 80525
Phone:
970-215-0825 Email: jberry@innovativegis.com
Website: www.innovativegis.com/basis
Abstract
Mapping yield, soil, terrain and other conditions is becoming commonplace on many farms. The maps help producers visualize the variation in their fields, but rarely analyzed to their full potential. Emerging data analysis techniques extend graphic interpretation to data analysis and provide insight into important relationships within and among the mapped data. This presentation describes a series of grid-based analysis techniques designed to highlight unusual areas in a field, identify significant differences between maps and develop important relationships between one map, such as yield, and other maps, such as soil conditions and micro-terrain. A case study will serve to illustrate the considerations and procedures used in site-specific management of agricultural crops.
___________________