Data Analysis Considerations
and Procedures
for Site-Specific Crop
Management
by Joseph K. Berry1
Click <here> to
view the complete online slide set and notes accompanying this topic.

www.agriculture.com
…Online articles and active discussion
forum on technology
________________________________
Part 1 – Understanding Mapped Data and Basic Analysis Approaches
 Mapping
yield, soil, terrain and other conditions is becoming commonplace on many
farms. The maps help producers
visualize the variation in their fields, but rarely analyzed to their full
potential. Emerging data analysis
techniques extend graphic interpretation to data analysis and provide insight
into important relationships within and among the mapped data. This two-part @gInnovator Online
presentation describes a series of grid-based analysis techniques designed to
highlight unusual areas in a field, identify significant differences between
maps and develop important relationships between one map, such as yield, and
other maps, such as soil conditions and micro-terrain. A case study will serve to illustrate the
considerations and procedures used in site-specific management of agricultural
crops.
Mapping
yield, soil, terrain and other conditions is becoming commonplace on many
farms. The maps help producers
visualize the variation in their fields, but rarely analyzed to their full
potential. Emerging data analysis
techniques extend graphic interpretation to data analysis and provide insight
into important relationships within and among the mapped data. This two-part @gInnovator Online
presentation describes a series of grid-based analysis techniques designed to
highlight unusual areas in a field, identify significant differences between
maps and develop important relationships between one map, such as yield, and
other maps, such as soil conditions and micro-terrain. A case study will serve to illustrate the
considerations and procedures used in site-specific management of agricultural
crops.
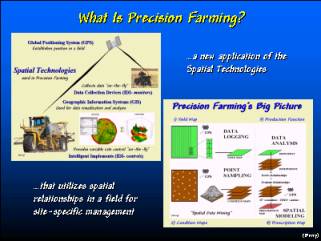 Precision farming combines GPS and GIS
technology with intelligent devices/implements. Them result replaces “whole field” management with site-specific
practices that changes farm inputs and actions throughout a field.
Precision farming combines GPS and GIS
technology with intelligent devices/implements. Them result replaces “whole field” management with site-specific
practices that changes farm inputs and actions throughout a field.
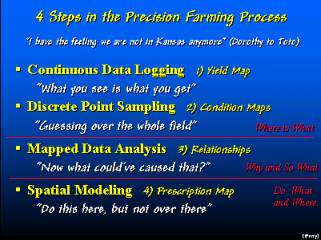 The first two steps in the Precision Farming
Process create maps of important factors such as crop yield and soil nutient
levels. The third step discovers
relationships between the patterns contained in the map layers. The final step utilizes the relationships to
establish a map of where management response should change.
The first two steps in the Precision Farming
Process create maps of important factors such as crop yield and soil nutient
levels. The third step discovers
relationships between the patterns contained in the map layers. The final step utilizes the relationships to
establish a map of where management response should change.
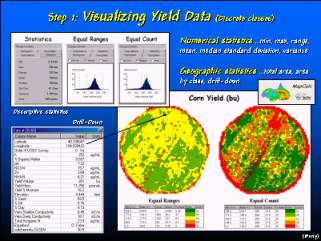 GIS maps are numbers first, pictures
later. The maps are composed of an
organized set of numbers that depict the spatial pattern in a field. In this example, the yield data for a
central-pivot, corn field is displayed using two different ‘contouring” methods
that form dramatically different visual impressions from the same data set.
GIS maps are numbers first, pictures
later. The maps are composed of an
organized set of numbers that depict the spatial pattern in a field. In this example, the yield data for a
central-pivot, corn field is displayed using two different ‘contouring” methods
that form dramatically different visual impressions from the same data set.
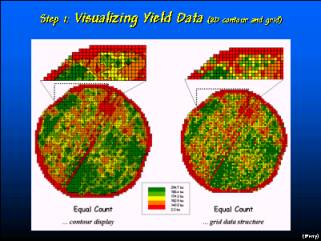 There are two map forms for displaying 2D
maps—contour and grid display. While
contour displays are most familiar, they create irregular data groupings
(polygons) that are difficult to use in further analysis. Grid data structure, on the other hand, uses
a consist analysis grid that contains the information and provides a means for
analyzing relationships among sets of maps.
There are two map forms for displaying 2D
maps—contour and grid display. While
contour displays are most familiar, they create irregular data groupings
(polygons) that are difficult to use in further analysis. Grid data structure, on the other hand, uses
a consist analysis grid that contains the information and provides a means for
analyzing relationships among sets of maps.
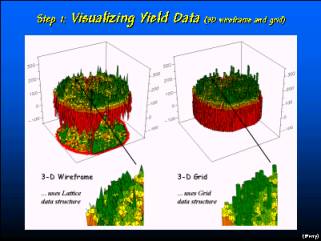 There are two map forms for displaying 3D
maps—wireframe and grid display. A
wireframe display connects the centroid of each grid cell (termed a lattice
data structure) with lines. A 3D grid
display, on the other hand, “extrudes” the cell sides to represent the map
value at each location.
There are two map forms for displaying 3D
maps—wireframe and grid display. A
wireframe display connects the centroid of each grid cell (termed a lattice
data structure) with lines. A 3D grid
display, on the other hand, “extrudes” the cell sides to represent the map
value at each location.
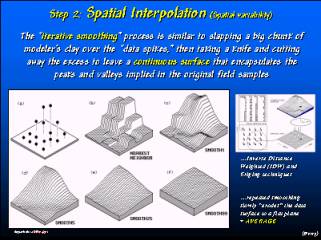 Point data can be spatially interpolated to
create a continuous surface map that estimates values for locations between the
samples. The surface represents the
spatial distribution of samples. In
this example, visual inspection of the plot of the point data (upper-left
portion of the left figure) indicates higher values occur in the northeastern
portion of the field. Continuous
smoothing of the distribution results in a flat plane (lower-right portion of
the left figure) that represents the simple average of the samples. Map analysis involves creating and analyzing
map surfaces.
Point data can be spatially interpolated to
create a continuous surface map that estimates values for locations between the
samples. The surface represents the
spatial distribution of samples. In
this example, visual inspection of the plot of the point data (upper-left
portion of the left figure) indicates higher values occur in the northeastern
portion of the field. Continuous
smoothing of the distribution results in a flat plane (lower-right portion of
the left figure) that represents the simple average of the samples. Map analysis involves creating and analyzing
map surfaces.
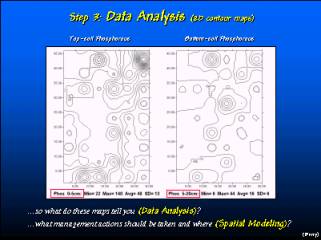 These two maps depict the relative amounts
of phosphorous in the top and sub-soil in a cornfield. By simply viewing the two contour maps one
is hard-pressed to see the differences and similarities in the patterns.
These two maps depict the relative amounts
of phosphorous in the top and sub-soil in a cornfield. By simply viewing the two contour maps one
is hard-pressed to see the differences and similarities in the patterns.
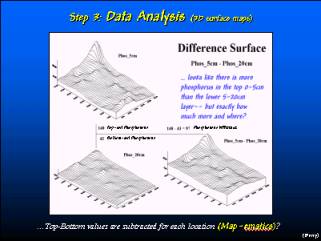 Map analysis uses the underlying data values
to compute the differences between the two maps.
Map analysis uses the underlying data values
to compute the differences between the two maps.
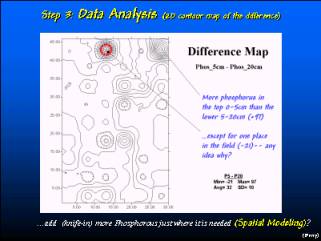 A contour display of the difference map
locates subtle differences between the two maps. Note that the topsoil levels of phosphorous are much higher in
most of the field— with very large differences in the northern portion of the
field.
A contour display of the difference map
locates subtle differences between the two maps. Note that the topsoil levels of phosphorous are much higher in
most of the field— with very large differences in the northern portion of the
field.
__________________
These @gInnovator Online materials are based on an invited presentation for the Agriculture Discipline Forum, MidAmerica GIS Symposium on “Strengthening the Growing Geodata Community,” Osage Beach, Missouri, May 14-18, 2000.
Data Analysis Considerations and Procedures for Site-Specific Crop Management
 1Joseph
K. Berry, Columnist for @gInnovator Newsletter, Meredith Publishing
1Joseph
K. Berry, Columnist for @gInnovator Newsletter, Meredith Publishing
![]() President, Berry and
Associates // Spatial Information Systems
President, Berry and
Associates // Spatial Information Systems
 2000 South College Avenue,
Suite 300, Fort Collins, CO 80525
2000 South College Avenue,
Suite 300, Fort Collins, CO 80525
Phone:
970-215-0825 Email: jberry@innovativegis.com
Website: www.innovativegis.com/basis
Abstract
Mapping yield, soil, terrain and other conditions is becoming commonplace on many farms. The maps help producers visualize the variation in their fields, but rarely analyzed to their full potential. Emerging data analysis techniques extend graphic interpretation to data analysis and provide insight into important relationships within and among the mapped data. This presentation describes a series of grid-based analysis techniques designed to highlight unusual areas in a field, identify significant differences between maps and develop important relationships between one map, such as yield, and other maps, such as soil conditions and micro-terrain. A case study will serve to illustrate the considerations and procedures used in site-specific management of agricultural crops.
___________________