Mapping In-Store
Shopper Movement and Sales
by Joseph K. Berry
President of Berry & Associates // Spatial Information Systems, Inc. (BASIS)
E-mail joeb@cnr.colostste.edu
(Article for GBA News, The GeoBusiness Association, Fort Collins,
Colorado, in press. For more information on related activities access http://www.gba.org on the Internet)
 GIS has certainly changed mapping’s image. The
revolution, however, isn’t as much technology, as an entirely new perception of
spatial data. My first taste of a digital map was at UC Berkeley in 1966 when it took
nearly a year to plot a 5-foot contour map from a couple of boxes of cards generated by an
analytical stereo plotter—a traditional map, all be it derived via untraditional
means. Today the digital map is the tradition, whereas the information it contains is
often untraditional.
GIS has certainly changed mapping’s image. The
revolution, however, isn’t as much technology, as an entirely new perception of
spatial data. My first taste of a digital map was at UC Berkeley in 1966 when it took
nearly a year to plot a 5-foot contour map from a couple of boxes of cards generated by an
analytical stereo plotter—a traditional map, all be it derived via untraditional
means. Today the digital map is the tradition, whereas the information it contains is
often untraditional.
A case in point is a recent pilot project for a major retail chain undertaken
by HyperParallel Corporation of San Francisco, California. HyperParallel focuses on data
analysis of large data sets, such as those generated through retail sales. A frequent use
of their sophisticated data mining and knowledge discovery software is developing
prediction models from cash register records. Traditionally, these analyses derive
non-spatial insights, such as product affinities (the probability of joint occurrence of
items in a shopping cart), vital for product forecasting and stocking.
The pilot project involved a radically new view of the data by considering its
spatial patterns. Relative accessibility forms the basis of traditional GIS Competition
Analysis and Targeted Marketing. Shoppers are seen as linked to stores by either simple
buffers (as-the-crow-flies), or more realistically, as effective distances along a network
of roads.
Movement within a store is conceptually similar, but the geographic factors and
basic approach are different. The analysis scale collapses from miles along a road
network, to feet through a maze of aisles and fixtures. Since the rules of the road and
fixed widths of pavement don’t exist, shoppers move through capricious routes. This
complexity of movement suggests that surface analysis (raster) is more appropriate than
the traditional network analysis (vector) for modeling in-store movement, sales densities
and statistical analysis among maps.
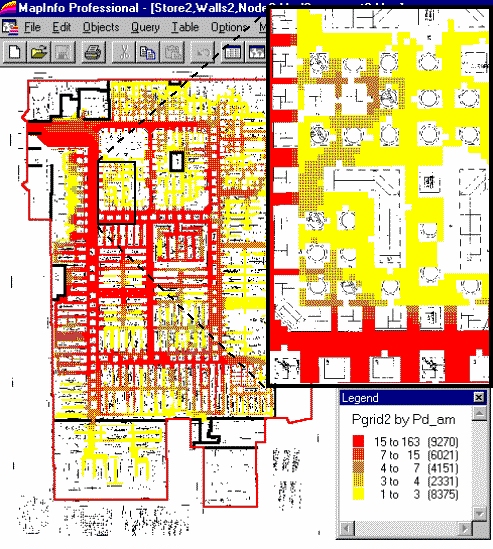
 The
floor plan of a superstore was scanned to produce a high-resolution backdrop for on-screen
digitizing of important features, such as walls, doors, and fixtures (see figure).
"Sales nodes" for each fixture face were digitized and assigned an ID# serving
as an addresses for products on the shelves. A special program was used to generate a
one-foot "pseudo-grid" in MapInfo and for data exchange with the pMAP grid
analysis system.
The
floor plan of a superstore was scanned to produce a high-resolution backdrop for on-screen
digitizing of important features, such as walls, doors, and fixtures (see figure).
"Sales nodes" for each fixture face were digitized and assigned an ID# serving
as an addresses for products on the shelves. A special program was used to generate a
one-foot "pseudo-grid" in MapInfo and for data exchange with the pMAP grid
analysis system.
The plausible paths of shoppers are modeled through stepped accumulation
surface analysis based on the items in their shopping carts. The technique constructs an
effective proximity surface from a starting location (entry door) by "spreading"
out from it (increasing distance waves respecting intervening barriers) until the closest
visitation point is encountered (one of the items in the shopping cart). The first leg of
a shopper’s path is identified by "streaming" down the truncated proximity
surface (steepest downhill path). The process is repeated to the establish the next tier
of the surface by spreading from the current item’s location until another item is
encountered; then streaming over that portion of the surface for the next leg of the path.
The spread/stream procedure is continued until all of the items in the cart have been
evaluated. The final leg is delineated by moving to a checkout, then exit doors.
Similar paths are derived for additional shopping carts passing through the
checkouts. The paths for all of carts during a specified time period are aggregated and
smoothed to generate an accumulated shopper movement surface. Although it is difficult to
argue that each path faithfully tracks actual movement, the aggregate surface tends to
identify relative traffic patterns throughout the store. Shoppers adhering to "random
walk" or "methodical serpentine" modes of movement confound the process,
but their presence near their purchase points are captured—a space/time glimpse of
in-store shopper movement.
Sales activity for the same period is generated by linking the items in all of
the shopping carts to their appropriate shelving addresses and keeping a running count of
the number of items sold at each location. The sales summary map is smoothed into a
continuous surface by moving a "roving window" around the map and averaging the
number of sales within a ten-foot radius of each analysis grid cell (1 square foot). The
resulting surface provides another view of the items passing through the checkouts—a
space/time glimpse of in-store sales action.
Statistical analysis of the movement and sales surfaces identifies unusual and
interesting patterns within and among the mapped data. For example, a standard normal
variable surface, identifies areas of statistically high and low conditions. Coincidence
analysis identifies areas of concern that have high movement, but low sales (a
retailer’s nightmare). Spatial affinities of products identify items that routinely
appear together in shopping carts, but are shelved at opposite ends of the store.
The most intriguing aspect of the project was the encapsulation of a MPEG movie
showing hourly time steps of the movement and sales maps. When the side-by-side displays
are animated, the darker tones (warmer colors) of higher activity appear to roll in and
out like wisps of fog under the Golden Gate Bridge. The similarities and miss-matches in
the ebb and flow of movement and sales provide a dramatic view (and new insights) of the
spatial/temporal relationships contained in traditionally non-spatial records from the
checkouts—rendering complex and colorless data into pictures of spatial relationships
suitable for human consumption.
_______________________
Note: this topic is discussed in more detail in the "Beyond
Mapping" column in GIS World magazine, February through May, 1998. A PowerPoint
presentation (Instore.ppt, 688KB)
desribes the application of accumulation surface analysis to shopper movement.