
…an introduction to
grid-based map analysis and modeling
GEOG 3110,
University of Denver, Geography
Below
is a list of general “report
writing tips” that might be useful in class exercises. Hopefully
these tips will help the “final” polishing of your reports (and in real life
beyond!!!) --Joe
Underlying
Principle: Report writing is all about helping the
“hurried” reader 1) see the organization of you thinking, as well as 2) clearly
identify the major points in your discussion.
…Report
Writing Tip #1: enumeration is useful in report writing as the reader usually is in a hurry and
wants to “see” points in a list.
…Report
Writing Tip #2: when expanding on an
enumerated list you might consider underlining the points to help the
hurried reader “see” your organization of the extended discussion/description.
…Report
Writing Tip #3: avoid long paragraphs
with several major points—break large, complex paragraphs into a set smaller
ones with each smaller paragraph containing a single idea with
descriptive sentences all relating to the one thought. Don’t be “afraid” to
have a paragraph with just one sentence.
…Report
Writing Tip #4: it is a good idea to use
two spaces in separating sentences as it makes paragraphs less dense …makes
it easier to “see” breaks in your thoughts—goes with the “tip” to break-up long
paragraphs as both are distracting/intimidating to a hurried reader as they
make your writing seem overly complex and difficult to decipher. Most professional reports do not indent
paragraphs—appears more “essay-like” than report-like. A report is not a literary essay.
…Report
Writing Tip #5: avoid using personal pronouns (I, we, me,
etc.) in a professional report. A report is not a letter (or a
text message).
…Report
Writing Tip #6: “In order to…” is a redundant
phase and should be reduced to simply “To…” For example, “In order to
empirically evaluate the results …” is more efficiently/effectively written as
“To empirically evaluate the results…” This and two other points of
grammar are often used to “differentiate” the Ivy scholar from the inferior
educated masses. The other two are 1) the split infinitive ( e.g., This thing also is going to be big, not “…is
also going to be…”; don’t stick adjectives or adverbs in the middle of a
compound verb) and extraneous hyperbole (e.g., “That’s a really good
map for…” versus “That’s a good map for…”; avoid using “really”).
…Report
Writing Tip #7: need
to ALWAYS include a caption with any embedded graphic or table.
Also, it is a general rule is that if a figure is not discussed in the text it
is not needed—therefore, ALWAYS direct the reader’s
attention to the graphic or table with a statement of its significance to
the discussion point(s) you are making.
…Report Writing Tip #8: ALWAYS have Word’s Spelling
and Grammar checkers turned on. When reviewing a document, right click on Red (spelling error) and
Green (grammar error)
underlined text and then correct.
…Report Writing Tip #9: it is easiest/best to construct (and
review) a report in “Web Layout” as page breaks do not affect the
placement of figures (no gaps or “widows”).
Once the report is in final form and ready for printing, you can switch
to “Print Layout” and cut/paste figures and captions as needed.
…Report Writing Tip #10: be sure to use a consistent font and
pitch size throughout the report.
Change font only to highlight a special point you are making or if you
insert text from another source (include the copied section in quotes).
…Report
Writing Tip #11: don’t use
“justify” text alignment as it can cause spacing
problems when a window is resized in “Web Layout” view; the document will not
be printed ...it’s the “paperless society,” right? Also, be consistent with line spacing …usually single space
(or 1.5 space) is best …avoid double spacing as it takes up too much
“screen real estate” went viewing a report.
…Report
Writing Tip #12: it is
easier (and more professional) to use a table for the multiple screen gabs and
figure #/title/caption as everything is “relatively anchored” within the table
and pieces won’t fly around when resizing the viewing window—
…be sure to keep the table width within page margin
limits if you plan to print (also for easier viewing in Web Layout).
|
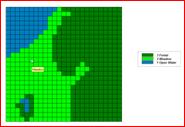
CoverType
map |
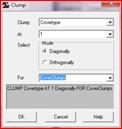
CLUMP
dialog box |
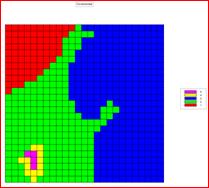
CLUMPED
CoverType map |
|
Figure 2-1. Script construction and map output for the CLUMP
operation. The left inset shows the
CLUMP operation settings. The CoverClumps output map on the right identifying unique
map values for each “contiguous Covertype grouping”
is displayed in discrete 2D grid format with layer mesh turned on. |
||
…the easiest (and
best) way to center items in the table is to click on each item and choose
“Center” from the Paragraph tools; to create upper and lower spacing Select the
entire table and the Table Propertiesà Cell tabà Cell Optionsà uncheck Cell Margins
boxà specify .08 as both top and bottom margins.
___________________________