GeoWorld Articles
|
Further Understanding Spatial Patterns and Relationships ( |
Feature article for GeoWorld,
June 2001, Vol. 14, No. 63, pgs. 58-59
<Click here>
right-click for a printer-friendly version of this paper (.pdf).
Mapcalc Learner: Quick-take Review
by
W. Fredrick Limp
Price: Single user-$21.95, academic lab license-$495.
Requirements: Microsoft Windows.
Company: Red Hen Systems Inc., 2310 E. Prospect Road, Suite A,
Fort Collins, CO 80525 [800-237-4182, fax: 970-493-3938, e-mail:
info@redhensystems.com, Web: http://www.redhensystems.com].
Introduction
MapCalc Learner is the latest and most accessible incarnation in a
lineage of groundbreaking raster software packages. MapCalc Learner originated
in the late 1970s with the creation of raster extensions to the famous SYMAP
program. In time, SYMAP led to MAP, which led to pMAP, which led to aMAP, which
led to MapCalc (for more information, see "The MapCalc Legacy,"
below). Throughout all these developments, Joe Berry, author of GeoWorld's
"Beyond Mapping" columns, was present.
MapCalc represents the latest version of raster software specifically
designed to help students learn the rich range of analysis options available in
the raster domain. In addition to the software itself, MapCalc Learner comes
with myriad case studies, examples, graphics and workflows written by
Anyone familiar with the "Beyond Mapping" columns knows their
clarity and range, but, if you've tried to duplicate
Analytical Operations
MapCalc Learner has an excellent range of standard raster operators,
but also includes several powerful advanced operations. "Clump," for
example, identifies contiguous areas; "Configure" allows a wide range
of shape and structural analyses such as the number of exterior cells and
holes; "Size" computes the areas for each analysis; "Span"
calculates the minimum width of each contiguous area from edge to edge; and
"Spread" is a module that creates "traditional buffers,"
but it also allows spreading over an elevation data surface or through a
friction surface. Users can specify that movement is only uphill or downhill
and that movement is restricted or permitted over flat areas.
The "Composite" module allows users to compute values from
one map within categories in another map. For example, users can compute the
average slope in each farm field. Composite operations include average, median,
standard deviation, majority, minority, coefficient of variation, diversity,
etc. The "Scan" operation applies similar operations, but to a
predefined neighborhood around each cell. Comprehensive map computations (e.g.,
Map 1 plus Map 2) are possible with many operators available.
The "Analyze" function allows users to compute a range of
statistics for each cell across multiple maps. "Crosstab" generates a
table of cross occurrence of values in two maps, while "Intersect"
creates a map with a different map category reflecting various combinations in
two input maps. For example, forest and steep could be one category while
forest and flat could be another. There are several operations that use an
elevation (or "elevation-like") dataset. "Drain" operations
create maps showing all steepest descent paths from each location to adjacent
ones, while "Stream" follows an individual descent path (such as what
water would follow).
In addition, "Radiate" computes viewsheds, allowing users to
enter "through" and "onto" maps. The "through"
map layer would have heights of features such as trees that can block a view,
while "onto" represents heights of features that can be illuminated.
The module can compute the number of starting cells that can "see"
each cell in the map. Other parameters allow users to assign weights to the
starting cells that would be applied to each viewed cell. A cell viewed from
cells with high weights would have larger values than a cell viewed from
lower-weighted locations. An interesting option computes a "maximum
prominence angle" for each seen location. A somewhat related operation
called "Profile" calculates the height relationship for each cell and
its neighbors.
Statistical Operations
MapCalc Learner has a wide range of standard statistical operations,
but it also provides a series of innovative functions. The "Cluster"
operation performs a classification process, identifying cells based on their
similarities across multiple maps. The "Correlate" operation creates
a correlation matrix for multiple maps, and "Compare" prepares a
table of statistics comparing two maps. "Regress" performs a linear
regression on values in each cell in multiple independent maps, outputting a
map with the estimated value for the dependant map's cell. The "Relate"
operator determines the degree of similarity of a second (or multiple) map to
an evaluation map.
There are several operations that allow point data to be converted to a
cell structure using a variety of interpolation methods, including
kriging. All of the MapCalc operations have many additional parameters
that allow great flexibility.
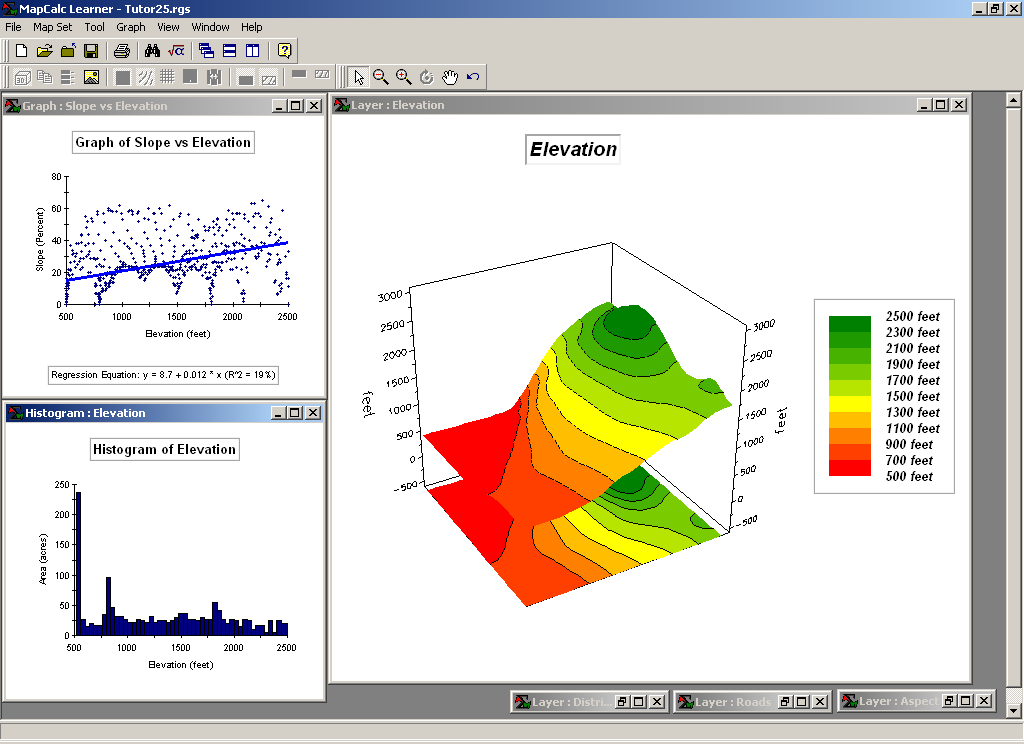
Figure 1. MapCalc learner
provides an extraordinary combination of economy and power.
Surfer and Documentation
Included
In addition to the base software, a demo version of the popular Surfer
version 7 system from Golden Software is included. The demo version is fully
functional, but the output capabilities are disabled. In addition to the normal
documentation expected, MapCalc Learner includes all the "Beyond
Mapping" columns Berry has written from 1996-2000 as well as the Precision
Farming Primer, which is a compilation of columns on the subject from
@gInnovator from 1993-2000. It also should be noted that
Versions and Formats
An instructor's version of MapCalc Learner is planned with a projected
price of $495, which will include multiple lab seats and a large suite of
instructor-oriented overheads and materials. A professional version also is
planned for release later in 2001. All the current MapCalc Learner analysis
operations will be present as well as additional capabilities. Of course, the
100 by 100 limit on map size will be removed.
Vector import formats supported are .shp and .tab, and raster input
formats include ASCII matrix, ESRI grid and Surfer grid. Image formats that can
be used are BMP, JPG, TARGA, Photoshop, Windows metafile, Zsoft (pex), PNG, Sun
raster and Mac PICT. Vector data can be exported to ASCII, ESRI or Surfer grids
or latitude/ longitude values.
Some Limitations
MapCalc Learner's data files are limited to a maximum of 100 rows by
100 columns, and all data must be in WGS84 datum. Also, MapCalc Learner doesn't
have a re-project capability. Although complex cartographic modeling is
possible, hard-copy cartographic composition is limited to a basic structure.
There are no scale bars and north arrows, and legends and other text and images
aren't moveable. Legends can be located at the top, sides or bottom, but they
can't be repositioned using the mouse.
However, MapCalc has a solid range of map display capabilities,
including a quick 3-D view. Color control is extensive, and there are several
methods to group continuous data. In addition to raster mapping, there are
several charting and graphing options. There's no vector interaction
capability, such as overlaying a vector on a raster or summarizing a raster map
within vector polygons. But users can convert any vector to a raster and
accomplish an equivalent operation in the raster domain.
If you're serious about learning the full range of
"map-ematical" opportunities possible in raster GIS, MapCalc Learner
provides an extraordinary combination of economy and power. The documentation
alone is worth the price of admission.
MapCalc Learner
Strengths: Features an extensive suite of
"map-ematical" and spatial operations; large amounts of high-quality
documentation, examples and workflows; and a fantastic price.
Weaknesses: Has poor cartographic output and no
projection support (all data must be in WGS84).
The MapCalc Legacy
MapCalc has one of the longest and most distinguished histories of any
spatial analysis software product. Its origins are directly connected to one of
the key pioneering projects in raster GIS, dating back to a dissertation at
Doctoral student C. Dana Tomlin worked with professors Joseph K. Berry
(major advisor) and Kenneth L. Reed to extend the grid analysis module in
In 1982, the MAP source code was obtained by HDR, a Santa Barbara,
Calif.-based consulting firm. At first, it was envisioned that the code would
be translated from FORTRAN to the Pascal language needed in the project, but
the unstructured code required complete re-coding. Reed and
In 1986, Reed and
In fall of 1997, Red Hen Systems Inc. began developing a product called
SoilRx, which it released in late 1998. The software accepts yield and sample
data and then spatially interpolates these values into continuous maps of crop
productivity and soil nutrient, properties, conductivity and other
distributions for a field. The advanced 2-D and 3-D graphics, charting
functions and grid math capabilities enable farmers to visualize and interact
the spatial relationships within and among precision agriculture data. The software
is primarily used to help identify management zones of similar data
characteristics and develop prescription maps that use variable-rate technology
to adjust the amount of chemicals applied throughout a field.
In spring 1998, Red
Hen Systems began purchasing deployments of the pMAP modules to enhance the
spatial analysis capabilities of SoilRx. In April 2000, Red Hen Systems
acquired SIS and all rights to the pMAP code. MapCalc Learner and Academic
packages are the educational versions of the software based on the integration
of SoilRx and pMAP technologies. A commercial version of MapCalc is under
development, and a developer's version based on the MapCalc library of Active X
controls is under consideration.
_____________________
Limp Is the director of the Center for
Advanced Spatial Technologies, 12 Ozark Hall, University of Arkansas,
Fayetteville, AR 72701; e-mail: fred@cast.uark.edu.