(book in preparation – May 2007)
Map Analysis: Understanding Spatial Patterns and Relationships
W.M. Keck Scholar in Geosciences at the
Principal of
Berry & Associates // Spatial Information Systems
This book is a collection of selected works from
of Joseph K. Berry’s popular “Beyond Mapping” columns published in GeoWorld
magazine from 1996 through 2006. In this
compilation
While numerous books focus on Geographic
Information Systems (
___________________________
Note: the online links access http://www.innovativegis.com/basis/MapAnalysis/,
select Topic and Section as indicated
Table of Contents
Foreword (to be determined)
Preface
Sub-headings
of Map Analysis, Intended Readership,
Book Organization,
Case Study Data Sets, Companion CD, Book Website, and Acknowledgements
___________________________
Introduction — As
1 Early
…current online link T27, select “Early
GIS Technology and Its Expressions”
2
Contemporary
…current
online
link T27, select “Contemporary
GIS and Future Directions”
Further
Reading (companion CD)
-
Keywords for Online Search — listing of several keywords that can be used
in online searches for additional material related to the discussion of GIS
history and trends.
-
Companion Software — link to MapCalc Learner Quick-take Review describing system
requirements, capabilities, analytical operations, statistical operations,
documentation, limitations and legacy.
-
Multimedia Mapping — four references describing how photos and streaming
video can be geographically referenced and used in multimedia applications.
-
Virtual
Reality and GIS — four references
describing the
underlying concepts, procedures and potential applications of linking GIS with
virtual reality displays.
-
Software Design — four references discussing the evolution of GIS
software and basic concepts in object-oriented technology.
Hands-on
Experience (companion CD)
 Exercise I.1 Examples of Analysis Capabilities — in this exercise you will access
two short video demos on MapCalc Basics and on Calculating Slope and Surface
Flow. The first video demonstrates basic
use including interactive
2D/3D plotting, display types, display navigation, accessing maps for display
and graphical overlay. The second video illustrates some of the basic map
analysis capabilities.
Exercise I.1 Examples of Analysis Capabilities — in this exercise you will access
two short video demos on MapCalc Basics and on Calculating Slope and Surface
Flow. The first video demonstrates basic
use including interactive
2D/3D plotting, display types, display navigation, accessing maps for display
and graphical overlay. The second video illustrates some of the basic map
analysis capabilities.
 Exercise I.2 Viewing Full Color Figures — this exercise demonstrates how
to access the full color versions of the B&W figures in the Map Analysis
book. The figures are in standard
PowerPoint files by Topic for easy access and printing in a variety of formats.
Exercise I.2 Viewing Full Color Figures — this exercise demonstrates how
to access the full color versions of the B&W figures in the Map Analysis
book. The figures are in standard
PowerPoint files by Topic for easy access and printing in a variety of formats.
![]()
![]()
![]() Exercise I.3 Installing Companion Software — this exercise includes
guidelines for installing and testing the MapCalc Learner, Surfer Demo and
SnagIt Evaluation software included on the companion CD.
Exercise I.3 Installing Companion Software — this exercise includes
guidelines for installing and testing the MapCalc Learner, Surfer Demo and
SnagIt Evaluation software included on the companion CD.
 Exercise I.4 Software Tutorials — this exercise describes how to
access the companion software standard tutorials. The optional MapCalc and Surfer tutorials
provide an overview of procedures and capabilities of the software that are
covered in greater detail in the individual exercises for each of the Topics in
this book. You are encouraged to
complete the SnagIt tutorial as general familiarity with this software is
assumed in the exercises.
Exercise I.4 Software Tutorials — this exercise describes how to
access the companion software standard tutorials. The optional MapCalc and Surfer tutorials
provide an overview of procedures and capabilities of the software that are
covered in greater detail in the individual exercises for each of the Topics in
this book. You are encouraged to
complete the SnagIt tutorial as general familiarity with this software is
assumed in the exercises.
___________________________
Topic 1. Data Structure Implications —
3 Grids
and Lattices Build Visualizations (GW, July 2002) — describes Lattice and Grid graphic forms for displaying
continuous surface data.
…current online link T18,
select “Visualizing Grid-Based
Data”
4 Maps Are Numbers First, Pictures Later (GW, August 2002) — discusses the numeric and
geographic characteristics of data values used in representing discrete and
continuous maps.
…current online link T18, select “Maps
Are Numbers First, Pictures Later”
5 Normalize
Maps for Data Analysis (GW, September,2002)
— describes map normalization
procedures and data exchange among grid-based software packages.
…current online link T18,
select “Framing Maps for Data
Analysis”
Further
Reading (companion CD)
-
Keywords for Online Search — listing of several keywords that can be used
in online searches for additional material related to grid-based data structure
and display.
-
Comparing Paper and Digital Map Worlds — three references describing the conceptual
similarities/differences in data structure, resolution and referencing
- Data
Structure/Display Concepts — two references describing different
approaches to storing raster data and generating contour map displays.
- Data
Structure/Display Examples — five references providing annotated examples
of grid-based map data/display types, continuous/discrete data values and data
summary/display considerations.
Hands-on
Experience (companion CD)

 Exercise
1.1 Interacting with Grid Maps — in this exercise you will become
familiar with the basic layout and procedures for interacting with grid map
displays.
Exercise
1.1 Interacting with Grid Maps — in this exercise you will become
familiar with the basic layout and procedures for interacting with grid map
displays.

 Exercise 1.2 Grid-based
Thematic Mapping — this
exercise provides experience with the Shading Manager for setting contour
intervals of 2D contour map representations of continuous surface data.
Exercise 1.2 Grid-based
Thematic Mapping — this
exercise provides experience with the Shading Manager for setting contour
intervals of 2D contour map representations of continuous surface data.

 Exercise 1.3 Map
Summary Statistics and Charts — this
exercise investigates various mechanisms for generating statistical summaries
and charts continuous map surfaces.
Exercise 1.3 Map
Summary Statistics and Charts — this
exercise investigates various mechanisms for generating statistical summaries
and charts continuous map surfaces.
 Exercise 1.4 Map
Normalization — this exercise demonstrates
various techniques for normalizing mapped data.
Exercise 1.4 Map
Normalization — this exercise demonstrates
various techniques for normalizing mapped data.
___________________________
Topic 2. Fundamental Map Analysis Approaches — Map Analysis exploits the digital nature of modern maps
to investigate the patterns and relationships within and among mapped
data. This section uses a series of
examples to introduce the concept of a map-ematics and the
similarities/differences in Spatial Analysis and Spatial Statistics that form
the two primary compartments of the map analysis toolbox.
6 Moving
Mapping to Analysis of Mapped Data (GW, December 2004) — describes Spatial Analysis and Spatial Statistics as
extensions to traditional mapping and statistics.
…current online link T24
select “Moving
Mapping to Analysis of Mapped Data”
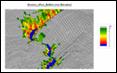
7 Bending
Our Understanding of Distance (GW, January, 2005) —
uses effective distance to establish an erosion
setback to demonstrate the advanced nature of Spatial Analysis.
…current online link T24, select “Bending Our Understanding of Distance”
8 Use
Spatial Statistics to Map Abnormal Averages (GW, February 2005) — discusses surface modeling to
demonstrate the advanced nature Spatial Statistics.
…current online link T24,
select “Beyond Mapping Abnormal Averages”
9 Making
Space for Mapped Data (GW, March 2005) — investigates the link between
Geographic Space and Data Space for mapping data distributions.
…current online link T24, select “Making Space for Mapped Data”
Further Reading (companion CD)
-
Keywords for Online Search — listing of several keywords that can be used
in online searches for additional material related to the overview discussion
of Map Analysis capabilities and applications.
-
General Overview — one reference discussing the
important distinctions among discrete mapping, continuous map surfaces and map
analysis.
-
General Application
Examples — three references
containing annotated examples demonstrating important concepts in visualizing
mapped data, comparing discrete maps and modeling campground suitability.
Hands-on Experience (companion CD)
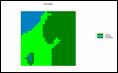
 Exercise 2.1 Viewing Base Maps — in this exercise you will become
familiar with the base maps used in the effective proximity buffer model.
Exercise 2.1 Viewing Base Maps — in this exercise you will become
familiar with the base maps used in the effective proximity buffer model.
 Exercise
2.2 Interacting with a Stored
Script
— this exercise
introduces the procedures for interacting with a stored script of spatial
analysis commands.
Exercise
2.2 Interacting with a Stored
Script
— this exercise
introduces the procedures for interacting with a stored script of spatial
analysis commands.
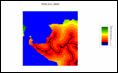
 Exercise
2.3 Implementing a Script for
Effective Erosion Buffers — this
spatial analysis exercise evaluates step-by-step a model for generating a
variable-width buffer around streams respecting the erosion potential of the
intervening terrain (slope and surface flow).
Exercise
2.3 Implementing a Script for
Effective Erosion Buffers — this
spatial analysis exercise evaluates step-by-step a model for generating a
variable-width buffer around streams respecting the erosion potential of the
intervening terrain (slope and surface flow).
 Exercise 2.4 Investigating Customer Location — this exercise investigates the base
maps used in the customer density model.
Exercise 2.4 Investigating Customer Location — this exercise investigates the base
maps used in the customer density model.
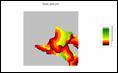
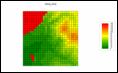
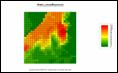
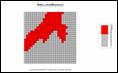
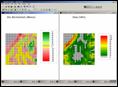
 Exercise 2.5 Characterizing Customer Density — this spatial statistics exercise
generates a customer density surface from customer locations and identifies
areas of high density as being more than one standard deviation above the mean.
Exercise 2.5 Characterizing Customer Density — this spatial statistics exercise
generates a customer density surface from customer locations and identifies
areas of high density as being more than one standard deviation above the mean.
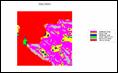
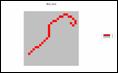 Exercise 2.6 Identifying
Unusually High Customer Density — this
exercise isolates the areas of
statistically high customer density and identifies customer locations within
this unusual region.
Exercise 2.6 Identifying
Unusually High Customer Density — this
exercise isolates the areas of
statistically high customer density and identifies customer locations within
this unusual region.
___________________________
Topic 3. Basic Techniques in Spatial Analysis — Spatial Analysis investigates the geographic context of
mapped data resulting from the relative positioning and coincidence of the map
values. This section discusses the
Reclassify and Overlay grouping of operators that form the basic techniques
used in most spatial models.
10 Use a Map-ematical Framework for
…current online link T22, select “A Map-ematical Framework for GIS
Modeling”
11 Options Seem Endless When Reclassifying
Maps (GW, April 2004)
— discusses basic
map reclassify operations involving changing map values as a function of
initial value, position, contiguity, size, or shape of the spatial
configuration of the values on a single map layer.
…current online at
T22, select “Reclassifying Maps”
12 Overlay Operations Feature a Variety of
Options (GW,
May 2004)
— discusses basic
map overlay operations involving changing map values as a function of the point-by-point or region-wide alignment
of the values associated with two or more existing map layers.
…current online link T22,
select “Overlaying Maps”
13 Computers Quickly Characterize Spatial
Coincidence (GW, June 2004) — describes the similarities and differences in how
humans and computers characterize, assess and summarize spatial coincidence.
…current online at T22, select “Characterizing Spatial Coincidence”
Further Reading (companion CD)
-
Keywords for Online Search — listing of several keywords that can be used
in online searches for additional material related to the discussion of
grid-based Reclassify and Overlay operations.
-
Spatial Coincidence — two references describing a
technique for handling unique combinations of map layers and shadow maps of
certainty can be used to estimate error and its propagation.
-
Micro-Terrain Analysis — one reference
describing the application of spatial analysis and surface modeling in
decision-making contexts.
Hands-on Experience (companion CD)
 Exercise
3.1 Spatial Analysis
Operations
— in this exercise you
will be introduced to the basic classes of map analysis operations and how to
access them when creating spatial models.
Exercise
3.1 Spatial Analysis
Operations
— in this exercise you
will be introduced to the basic classes of map analysis operations and how to
access them when creating spatial models.
![]()
 Exercise
3.2 Reclassifying Map
Features — this exercise demonstrates the
most basic class of map analysis operations within a logical processing
sequence.
Exercise
3.2 Reclassifying Map
Features — this exercise demonstrates the
most basic class of map analysis operations within a logical processing
sequence.
 Exercise 3.3 Characterizing Map Coincidence — this exercise identifies several
ways to represent and statistically summarize the spatial coincidence between
two discrete maps.
Exercise 3.3 Characterizing Map Coincidence — this exercise identifies several
ways to represent and statistically summarize the spatial coincidence between
two discrete maps.
 Exercise
3.4 Calculating Change — this exercise identifies the
grid math procedures for generating a map depicting the amount of change in a
continuous map variable between two periods.
Exercise
3.4 Calculating Change — this exercise identifies the
grid math procedures for generating a map depicting the amount of change in a
continuous map variable between two periods.
![]()
 Exercise 3.5 Summarizing Map Regions — this exercise demonstrates the
procedure for determining the average condition of one map variable (Slope)
occurring within the regions identified on another map (Districts).
Exercise 3.5 Summarizing Map Regions — this exercise demonstrates the
procedure for determining the average condition of one map variable (Slope)
occurring within the regions identified on another map (Districts).
 Exercise 3.6 Evaluating a Simple Habitat Model — this exercise uses a stored
script to demonstrate the derivation of a Binary, a Ranking and a Rating Suitability
Model of Hugag habitat considering slope, aspect and elevation preferences.
Exercise 3.6 Evaluating a Simple Habitat Model — this exercise uses a stored
script to demonstrate the derivation of a Binary, a Ranking and a Rating Suitability
Model of Hugag habitat considering slope, aspect and elevation preferences.
___________________________
Topic 4. Calculating Effective Distance — Traditional “as the crow flies” distance measured with
a ruler is rarely an effective in establishing separation between two points as
the reality of intervening barriers play a significant role that bends and
twists actual movement. This section discusses
the advanced Distance grouping of operators and expands the concept of simple
distance to effective proximity considering relative and absolute barriers to
movement.
14 Extending
…current online link T13, select “Creating Variable-Width
Buffers”
15 Create Effective Distance Buffers to
Improve Map Accuracy (GW, January 2001)
— develops
procedures for creating buffers that respond to the relative ease of
movement.
…current online link T13, select “Creating
Effective-Distance Buffers”
16 Measuring Distance Is
Neither Here nor There (GW, April 2005)
— discusses
the basic concepts of distance and proximity used in generating simple
proximity surfaces.
…current online
link T25, select “Neither Here nor There”
17
Extend Simple Proximity to Effective Movement (GW, June 2005) — discusses the basic concepts used in generating
effective proximity surfaces supporting that respond to relative and absolute
barriers to movement.
…current online link T25, select “Extending
Simple Proximity to Effective Movement”
Further Reading (companion CD)
-
Keywords for Online Search — listing of several keywords that can be used
in online searches for additional material related to calculating and using
effective proximity.
-
Calculating Simple and Effective Proximity — four references describing how simple and
effective proximity are calculated, as well as discussion about advanced
distance operations.
- Deriving and
Analyzing Travel-Time — five references on
the use of effective proximity for assessing travel-time using examples from
customer travel, hiking-time and connecting bus riders with their optimal
stops.
- Use of Travel-Time in Geo-Business — seven references on
the use of effective proximity for generating travel-time maps and procedures
used in analyzing travel-time advantage between competing stores, competition
zones, customer loyalty, as well as assessing in-store shopper movement
patterns and sales.
- Micro-Terrain Considerations and Techniques — three references describing procedures for
modeling surface flows to characterize erosion potential and determining uphill
proximity as a function of slope to identify valley bottoms.
- Surface Flow Considerations and Techniques — four references discussing basic concepts,
approaches and considerations in advanced surface flow modeling to include path, sheet,
horizontal and fill flows in tracking flow time and quantity.
-
Proximity-based Application
Examples — three references
containing annotated examples using effective proximity to model off-road
emergency response, uphill terrain steepness for landslide potential and
micro-terrain flows and pooling in an agricultural field.
Hands-on Experience (companion CD)
 Exercise 4.1
Calculating Simple Proximity — in this exercise you will first
create a map of the simple proximity to roads (as the crow flies) then mask the
result for just the areas on the island.
Exercise 4.1
Calculating Simple Proximity — in this exercise you will first
create a map of the simple proximity to roads (as the crow flies) then mask the
result for just the areas on the island.

 Exercise 4.2
Calculating Uphill Proximity — this exercise describes
generating proximity maps that respect a “guiding surface,” such as identifying
distances to only uphill locations.
Exercise 4.2
Calculating Uphill Proximity — this exercise describes
generating proximity maps that respect a “guiding surface,” such as identifying
distances to only uphill locations.

 Exercise 4.3
Calculating Effective Proximity — this exercise demonstrates
creating an effective proximity surface that respects intervening slope conditions
as impediments (relative and absolute barriers) to movement off the road
network.
Exercise 4.3
Calculating Effective Proximity — this exercise demonstrates
creating an effective proximity surface that respects intervening slope conditions
as impediments (relative and absolute barriers) to movement off the road
network.


 Exercise 4.4 Simple
Proximity Review — this exercise recaps deriving
simple proximity from a variety of “starting feature” locations (Roads—lines, Water—polygons,
Ranch—point).
Exercise 4.4 Simple
Proximity Review — this exercise recaps deriving
simple proximity from a variety of “starting feature” locations (Roads—lines, Water—polygons,
Ranch—point).


 Exercise 4.5
Effective Proximity Considering Intervening Conditions — this
exercise describes a simple model for assessing hiking time from the Ranch to
all other locations considering different intervening conditions (Roads and
Covertype maps).
Exercise 4.5
Effective Proximity Considering Intervening Conditions — this
exercise describes a simple model for assessing hiking time from the Ranch to
all other locations considering different intervening conditions (Roads and
Covertype maps).


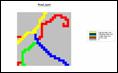
 Exercise 4.6
Identifying Optimal Paths — this exercise demonstrates
generating the optimal path (best) for hiking between the Ranch and the cabin
based on the effective proximity map (Accumulation Surface) derived in the
previous exercise.
Exercise 4.6
Identifying Optimal Paths — this exercise demonstrates
generating the optimal path (best) for hiking between the Ranch and the cabin
based on the effective proximity map (Accumulation Surface) derived in the
previous exercise.


 Exercise 4.7
Extending the Proximity Analysis — this exercise extends the effective
proximity analysis for hiking by including considerations of relative steepness
(slope) and aesthetics (visual connectivity to water).
Exercise 4.7
Extending the Proximity Analysis — this exercise extends the effective
proximity analysis for hiking by including considerations of relative steepness
(slope) and aesthetics (visual connectivity to water).
___________________________
Topic 5. Calculating
Visual Exposure — Visual analysis is
an extension of effective distance measurement that considers line-of-sight
connectivity among map locations. This
section discusses the procedures, considerations and applications of derived viewshed
and visual exposure maps.
18 Line-of-Sight Buffers Add
Intelligence to Maps (GW, December 2000)
— describes
procedures for creating line-of-sight buffers that track relative visual
exposure and noise levels.
…current online
link T13, select “Creating Line-of-Sight
Buffers”
19 Identify and Use Visual Exposure to Create
Viewshed Maps (GW, June 2001) — discusses basic considerations and procedures for
establishing viewsheds and visual exposure from point, line and polygonal
features.
…current online link T15, select “Identifying and Using Visual Exposure”
20 Visual Exposure Is in the Eye of the
Beholder (GW, July 2001) —investigates procedures for assessing simple
and weighted visual exposure.
…current online
link T15, select “There’s More That Meets
the Eye”
21 Use Exposure Maps and Fat
Buttons to Assess Visual Impact (GW, August 2001) — describes procedures for creating a
simple model that determines the relative visual impact of alternative power
line routes on local residences.
…current online link T15, select “Assessing Visual Impact”
Further Reading (companion CD)
-
Keywords for Online Search — listing of several keywords that can be used
in online searches for additional material related to viewshed and visual
exposure analysis.
-
Extended Visual Exposure Techniques — three references describing extended
techniques involving weighted visual exposure for assessing overall aesthetics
and visual vulnerability.
-
Visual Exposure Application Examples — two references containing annotated examples
using visual analysis in land planning and natural resource management
contexts.
Hands-on Experience (companion CD)

![]()
 Exercise 5.1 Calculating Viewsheds — in
this exercise you will first create a map of all the water locations (viewer
map) in the Tutor25 database and then generate a simple viewshed map that
indicates the visual connectivity to water— all locations are identified as
either 0= not seen or 1= seen from at least one water location.
Exercise 5.1 Calculating Viewsheds — in
this exercise you will first create a map of all the water locations (viewer
map) in the Tutor25 database and then generate a simple viewshed map that
indicates the visual connectivity to water— all locations are identified as
either 0= not seen or 1= seen from at least one water location.


 Exercise 5.2 Calculating Visual Exposure — this exercise demonstrates generating
a visual exposure map to water indicating the number water locations visually
connected to each grid location in a project area— 0= not seen with increasing
values indicating higher visual exposure to water.
Exercise 5.2 Calculating Visual Exposure — this exercise demonstrates generating
a visual exposure map to water indicating the number water locations visually
connected to each grid location in a project area— 0= not seen with increasing
values indicating higher visual exposure to water.

 Exercise 5.3 Accounting for Screens — this
exercise extends the previous exercise to create another visual exposure map to
water that accounts for a screening forest canopy of 75 feet and then compares
the result to the “non-screened” solution to determine the differences in the
two approaches.
Exercise 5.3 Accounting for Screens — this
exercise extends the previous exercise to create another visual exposure map to
water that accounts for a screening forest canopy of 75 feet and then compares
the result to the “non-screened” solution to determine the differences in the
two approaches.

 Exercise 5.4 Calculating Weighted Visual Exposure — this exercise first
calibrates Roads in terms of traffic flow and then creates a weighted visual
exposure map accounting for the relative amount of traffic on different road
types— 0= not seen from any road location with increasing values indicating
higher weighted visual exposure to traffic flows.
Exercise 5.4 Calculating Weighted Visual Exposure — this exercise first
calibrates Roads in terms of traffic flow and then creates a weighted visual
exposure map accounting for the relative amount of traffic on different road
types— 0= not seen from any road location with increasing values indicating
higher weighted visual exposure to traffic flows.


 Exercise 5.5 Modeling Visual Exposure Impacts — this exercise creates and
classifies visual exposure maps for relative connectivity to roads and houses
(Low, Medium, High) and then combines the two classified maps into a single map
that characterizes the joint visual exposure for each map location using a
2-digit code— a location with a value of 11 indicates 1= Low housing exposure
and 1= Low roads exposure; a value of 12= Low/Medium, … to a value of 33=
High/High.
Exercise 5.5 Modeling Visual Exposure Impacts — this exercise creates and
classifies visual exposure maps for relative connectivity to roads and houses
(Low, Medium, High) and then combines the two classified maps into a single map
that characterizes the joint visual exposure for each map location using a
2-digit code— a location with a value of 11 indicates 1= Low housing exposure
and 1= Low roads exposure; a value of 12= Low/Medium, … to a value of 33=
High/High.

 Exercise 5.6 Extending Visual Analysis to Other Areas — this
exercise creates a visual exposure map to roads and graphically overlays it on
the Elevation surface for the
Exercise 5.6 Extending Visual Analysis to Other Areas — this
exercise creates a visual exposure map to roads and graphically overlays it on
the Elevation surface for the
___________________________
Topic 6. Summarizing Neighbors — Values surrounding a location can be used to
investigate localized variation, anomalies, and trends in mapped data. This section discusses the advanced Neighbors
grouping of operators that characterize map values occurring within a roving
window centered at a location by either the surface configuration implied or a
simple statistical summary.
22 Computer Processing Aids Spatial
Neighborhood Analysis (GW, October 2005) — discusses procedures for calculating slope and profile from an
elevation surface (DEM).
…current
online link T26, select “Analyzing Terrain-based Neighborhoods”
23 Milking Spatial Context
Information (GW, November 2005) — describes a procedure for deriving a customer density
surface identifying relative concentrations of customers throughout a project
area.
…current
online link T26, select “Milking
Spatial Context”
24 Spatially Aggregated Reporting: The
Probability Is Good (GW, January 2006) — discusses techniques for smoothing “salt and pepper”
results and deriving probability surfaces from aggregated incident records.
…current online
link T26, select “The Probability is Good”
Further Reading (companion CD)
-
Keywords for Online Search — listing of several keywords that can be used
in online searches for additional material related to calculating and using
neighborhood summary operations.
-
Extended Neighborhood Techniques — three references describing customer density
analysis and extended techniques for weight-averaging filters using decay
functions.
-
Micro-Terrain Analysis — seven references describing techniques for
characterizing concave/convex features, localized variation and terrain
roughness, as well as discussion of terrain slope and its effect on surface
area calculations.
-
Landscape Analysis Techniques — four references describing techniques for
calculating nearby-neighbor statistics, core area/edge, fragmentation and other
landscape structure indices.
-
Landscape Structure Application Examples — three references containing annotated
examples for assessing cover type diversity, characterizing narrowness and
delineating/summarizing core area of landscape parcels.
Hands-on Experience (companion CD)
 Exercise 6.1 Calculating
Slope — in this exercise you will
calculate and visually compare several different maps characterizing terrain
steepness (slope).
Exercise 6.1 Calculating
Slope — in this exercise you will
calculate and visually compare several different maps characterizing terrain
steepness (slope).
 Exercise 6.2 Calculating
Aspect — this exercise demonstrates
calculating maps indicating terrain orientation (aspect).
Exercise 6.2 Calculating
Aspect — this exercise demonstrates
calculating maps indicating terrain orientation (aspect).
 Exercise 6.3 Solar Siting
Model — this exercise implements a
simple solar siting model that isolates locations with suitable terrain
steepness and orientation for passive solar collection.
Exercise 6.3 Solar Siting
Model — this exercise implements a
simple solar siting model that isolates locations with suitable terrain
steepness and orientation for passive solar collection.
 Exercise 6.4 Characterizing
Micro-terrain Conditions — this
exercise demonstrates techniques for identifying convex/concave terrain
features and assessing terrain roughness.
Exercise 6.4 Characterizing
Micro-terrain Conditions — this
exercise demonstrates techniques for identifying convex/concave terrain
features and assessing terrain roughness.
 Exercise 6.5 Calculating
Diversity — this exercise investigates cover
type diversity as a function of territorial movement (reach).
Exercise 6.5 Calculating
Diversity — this exercise investigates cover
type diversity as a function of territorial movement (reach).
 Exercise 6.6 Calculating Density
— this exercise uses a series of
commands to identify locations of high housing density that are near roads and
on dry land.
Exercise 6.6 Calculating Density
— this exercise uses a series of
commands to identify locations of high housing density that are near roads and
on dry land.
___________________________
Topic 7. Basic Spatial Modeling Approaches — Spatial Modeling involves “thinking with maps” to solve
a problem by deriving a solution map through a logical series of map analysis
operations applied to base maps in a manner analogous to a cooking recipe. This section describes a progression of
models that demonstrate the procedures and considerations in deriving areas of
suitable wildlife habitat.
25 Suitability Models Find the Good, the Bad
and the Hugag (GW, July 2004)
— develops a simple
Binary suitability model for characterizing wildlife habitat preferences.
…current online link T23, select “A Simple Habitat Model”
26 Mapping Techniques Rate
Hugag Habitat Suitability (GW, August 2004)
— expands
discussion to Binary Progression and Rating suitability models that contain
more information about relative habitat preferences and interactions.
…current online
link T23, select “Rating Habitat
Suitability”
27 Logic and Extent Elevate Suitability Models
to New Levels (GW, October 2004)
— extends the
discussion of the Rating Suitability model to include additional habitat
considerations and criteria weighting.
…current online
link T23, select “Extending Suitability
Models”
Further Reading (companion CD)
-
Keywords for Online Search — listing of several keywords that can be used
in online searches for additional material related to spatial modeling
approaches, procedures and applications.
-
Geo-Business Application Examples — three references containing annotated
examples for assessing customer access and store competition analysis.
-
Wildfire Application Examples — two references containing annotated examples
for modeling wildfire response and risk and a feature article describing an
extensive project modeling wildfire risk for the southern states..
-
Precision Agriculture Application Examples — five references containing annotated examples
for generating yield maps, summarizing sub-field areas, generating similarity
maps and assessing temporal and localized variation effects.
Hands-on Experience (companion CD)

 Exercise 7.1 Binary Habitat
Models — in this exercise you will
generate maps of suitable and unsuitable habitat areas based on terrain
conditions (slope, aspect and elevation) and then combine the maps two ways to
identify overall Binary and Ranking suitability for the project area.
Exercise 7.1 Binary Habitat
Models — in this exercise you will
generate maps of suitable and unsuitable habitat areas based on terrain
conditions (slope, aspect and elevation) and then combine the maps two ways to
identify overall Binary and Ranking suitability for the project area.

 Exercise 7.2 Basic
Suitability Model — this exercise demonstrates the
use of a continuous Rating approach to create a more robust suitability map on
a scale from 0= unsuitable to 1= poor through 9= excellent habitat.
Exercise 7.2 Basic
Suitability Model — this exercise demonstrates the
use of a continuous Rating approach to create a more robust suitability map on
a scale from 0= unsuitable to 1= poor through 9= excellent habitat.

 Exercise 7.3 Extended Suitability Model — this exercise extends the Hugag
Habitat Suitability model to another locale, then adds additional criteria
(Forest, Roads and Water), weighting of the relative importance of the criteria
and comparison of the impacts of the model extensions.
Exercise 7.3 Extended Suitability Model — this exercise extends the Hugag
Habitat Suitability model to another locale, then adds additional criteria
(Forest, Roads and Water), weighting of the relative importance of the criteria
and comparison of the impacts of the model extensions.

 Exercise 7.4 Campground
Suitability Model — this exercise implements a
stored command script for locating the best areas for a campground then weights
the relative importance of the criteria and compares the results.
Exercise 7.4 Campground
Suitability Model — this exercise implements a
stored command script for locating the best areas for a campground then weights
the relative importance of the criteria and compares the results.

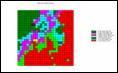
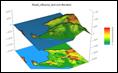
 Exercise 7.5 Landslide Susceptibility Model — this exercise implements a
stored command script for assessing the general landslide susceptibility then
extends the analysis to just the uphill locations from roads and summarizes the
susceptibility for administrative districts.
Exercise 7.5 Landslide Susceptibility Model — this exercise implements a
stored command script for assessing the general landslide susceptibility then
extends the analysis to just the uphill locations from roads and summarizes the
susceptibility for administrative districts.
___________________________
Topic 8. Spatial Modeling Example — Successful spatial models require the integration human
judgment and analytical processing. This
section describes the spatial reasoning and processing considerations
surrounding a routing model that considers preferences for a variety of map
criteria in determining the best path and optimal corridor for a proposed power
line.
28 A Three-Step Process Identifies Preferred
Routes (GW, July 2003) — describes the basic steps used in Least Cost Path
analysis for determining the optimal routing considering a single criterion.
…current
online link T19, select “Identifying
the Most Preferred Route”
39 Consider Multiple Criteria when Routing
(GW, August 2003) — expands discussion by
considering multiple siting criteria for an overall “cost/avoidance” map and
establishing optimal path corridors.
…current
online link T19, select “Considering
Multi-Criteria in Routing”
30 A Recipe for Calibrating and Weighting
…current
online link T19, select “Calibrating
and Weighting GIS Model Criteria”
31 Think
with Maps to Evaluate Alternative Routes (GW, October 2003)
— describes
procedures for comparing routes in terms of overall and site-specific “costs”
for alternative routes generated by different routing scenarios.
…current online link T19, select “Evaluating Alternative
Routes”
Further Reading (companion CD)
-
Keywords for Online Search — listing of several keywords that can be used
in online searches for additional material related to routing and optimal path
analysis.
-
Infusing Stakeholder Input into Routing — two references describing procedures for
integrating stakeholder input in calibrating and weighting model criteria used
in deriving alternative routes.
-
Extended Routing Techniques — three references describing procedures for
straightening and centering optimal paths and identifying optimal path networks
connecting disperse points.
-
Extended Accumulation Analysis Techniques — four references describing procedures for
constructing and analyzing accumulation surfaces, as well as deriving the Nth
best and stepped paths.
Hands-on Experience (companion CD)
___________________________
Topic 9. Basic Techniques in Spatial Statistics — Spatial Statistics utilizes information about the
spatial arrangement inherent in a data set to help explain variation and is
based on the assumption that “nearby things are more alike than distant
things.” This section focuses on surface
modeling techniques used to generate and evaluate the geographic distribution
implied by a set of discrete point samples.
32
…current online link T8, select “GIS Data Are Rarely Normal”
33 The Average is Hard to Find (GW, May 2006)
— introduces the fundamental concepts
involved in generating continuous geographic distributions from point sampled
data.
…current online link
T2, select “The
Average is Hardly Anywhere”
34 Under the Hood of Spatial Interpolation (GW, June 2006) — discusses the underlying assumptions and approaches used in Inverse
Distance and Kriging spatial interpolation techniques.
…current online link T2, select “Under
the Hood of Spatial Interpolation”
35
Justifiable Interpolation (GW, February 1997) — describes a procedure using Residual Analysis for evaluating spatial
interpolation results.
…current online link T2, select “Justifiable
Interpolation”
Further Reading (companion CD)
-
Keywords for Online Search — listing of several keywords that can be used
in online searches for additional material related to surface modeling and
spatial interpolation.
-
Modeling Error Propagation — two references describing procedures
utilizing “shadow maps of error” in assessing certainty of spatial coincidence
and generating “normalized error surfaces” for visualizing the geographic
distribution of error.
-
Point Sampling Considerations — two references discussing the concepts and
considerations in point sampling design, as well as the relative advantages of
different sampling patterns.
-
Advanced Concepts in Spatial Dependency — seven references discussing advanced concepts
in spatial dependency to include assessing spatial autocorrelation, the effects
of different spatial arrangements of point samples, generating maps of spatial
dependency and incorporating direction as well as distance in deriving spatial
autocorrelation.
Hands-on Experience (companion CD)
___________________________
Topic 10. Spatial Data
Mining — Spatial Data Mining
investigates the relationships within and among mapped data to characterize,
compare, segment and map-ematically model spatial dependency. This section focuses on basic techniques for
comparing maps, assessing similarity and clustering as means to understand and
utilize spatial relationships in decision-making.
36 Statistically Compare Discrete Maps (GW, July
2006) — describes a procedure using a Coincidence Summary Table to
quantitatively compare the similarity between the spatial patterns of two
discrete maps.
…current online link T16, select “Comparing Discrete Maps”
37 Comparing
Continuous Map Surfaces (GW, September 2006)
— describes a procedure for generating
and summarizing the difference between the geographic distributions of two
continuous map surfaces.
…current online link T16, select “Comparing Continuous Map Surfaces”
38 Geographic Software Removes Guesswork from
Map Comparisons (GW, October 2001)
— describes a procedure using Data
Distance to identify the relative similarity of the data pattern for a
specified location to the data patterns of all other locations within a map
stack of data.
…current online link T16, select “Calculating Map
Similarity”
39 Use Similarity to Identify Data Zones (GW, November 2001) — describes a procedure combining numerical and geographic
distributions to identify areas that are statistically unusual within a map
stack of data.
…current online link T16, select “Identifying Data Zones”
40 Use Statistics to Map Data
Clusters (GW, December 2001)
— describes a procedure using standard
Clustering techniques to identify areas having similar data patterns within a
map stack of data.
…current online link T16, select “Mapping Data Clusters”
41
Spatial Data Mining Down on the Farm (GW, August 2006) — describes the
basic steps in Precision Agriculture for site-specific crop management and
extends the discussion to a general Spatial Data Mining Process that addresses
mapped data analysis applications in other fields.
…current online link T16, select “Spatial Data Mining Down on the Farm”
Further Reading (companion CD)
-
Keywords for Online Search — listing of several keywords that can be used
in online searches for additional material related to spatial data mining.
-
Underlying Spatial Data Mining Concepts — four references discussing the linkages
between geographic space and data space used in characterizing data patterns
and their spatial arrangement.
-
Precision Agriculture Applications — three references describing the application of spatial data mining for
production increases, cost savings, improved stewardship and environmental
benefits.
-
Geo-Business Applications — three references discussing the application
of spatial data mining in assessing retail sales and predictive modeling.
-
Advanced Map
Comparison Techniques — three references
describing extended map comparison techniques for discrete maps and continuous
map surfaces.
-
Approaches Used in
Deriving Prediction Maps — three references
describing basic
concepts and procedures used in deriving equations for generating and
evaluating predictive map surfaces from a map stack of independent variables.
Hands-on Experience (companion CD)
___________________________
Epilog — GIS in general and map analysis in particular is
radically changing how we perceive and utilize maps. This section discusses different GIS adoption
paths, their driving factors and impacts on the current and future dynamics
within the GIS community.
42 Pathways to
43 A Multifaceted
Further
-
Keywords for Online Search — listing of several keywords that can be used
in online searches for additional material related to GIS community
characteristics and dynamics.
-
GIS Community Issues — two references discussing spatial reasoning
skills and the interaction between traditional science and spatial technology.
-
GIS Education Considerations — six references discussing how map
analysis is enlarging the traditional educational view of mapping, student
concerns, career paths and the relevance of grid-based map analysis in
contemporary curricula.
Hands-on Experience (companion CD)
___________________________
Appendix
(companion CD)
A.
Quick Set of Exercises — a short set of exercises demonstrating
several of the basic map analysis concepts within a geo-business context.
-
Installing
MapCalc
-
Mapped
Data Visualization and Summary
-
Identifying
Unusual Areas
-
Identifying
Data Zones
-
Creating
Travel-Time Maps
-
Competition
Analysis
-
Additional
Tutorial Exercises
B.
Creating Your Own Grid Database — describes procedures for creating a MapCalc
database and exchanging data with a variety of other systems.
-
Creating
Your Own Database (Empty Map Set)
-
Importing
Vector Data via Add New Layers
-
Importing
Grid Data via the File Tool
-
Importing
Grid Data via the Map Analysis Tool
-
Exporting
Grid Data via Map Analysis Tool
-
Exporting
Grid Data via File Tool
-
Seamless Data
Exchange with Surfer
-
Seamless Data
Exchange with MapInfo
___________________________
Resources
(companion CD)

1. Companion CD — Description of
support material and links to Further
Reading, Hands-on Experience, Text Figures, and Companion
Software contained on the companion CD.
Text Figures — this
item contains full color PowerPoint slide sets of all of the figures in the
book. Permission to copy for educational
use is granted. Reference figures as
“Figure x-xx from Map Analysis, Berry, 2006.”
Further Reading — this
item accesses additional online reading noted at the end of each Topic in the
Map Analysis book. There are nearly 100
further reading links organized by Topics to related Beyond Mapping columns,
GeoWorld feature articles and GeoTec papers.
Hands-on Exercises — this
item links to the detailed and annotated instructions for hands-on exercises
noted at the end of each Topic in the Map Analysis book. The exercises use the MapCalc Learner and
Surfer Demo companion software provided (see below for installation
instructions).
Example Applications — this
item accesses several annotated descriptions and example applications of
grid-based map analysis. Click on any of
the links in the listing to access the examples. All of the example applications were
developed using MapCalc Learner and can be replicated using the tutorial
database identified with each example.
Appendix — Appendix
A, Quick Set of Exercises, contains
an overview set of exercises covering the basic display and analytical
operations. Appendix B, Creating Your Own MapCalc Database,
describes procedures for configuring a new MapCalc database and data
import/export procedures for entering data and exchanging maps with other
software systems (MapInfo, ArcView, Arc Grid, and Surfer).
Install MapCalc — this
item installs the MapCalc Learner
software contained on the CD. Enter the
Serial Number and Release Code with the book to register the software. Links
to general tutorials and a .pdf file of the MapCalc manual are provided. See Instructor
CD description (below) for more information on fully licensed MapCalc
Academic and Professional systems.
Install Surfer — this
item installs the Surfer Demo
software contained on the CD. Software
registration is not required. The evaluation program is a nearly a full
function system (lacks printer/plotter output support). A link to general tutorials
is provided. See Instructor CD
description (below) for more information on fully licensed Surfer system.
Download SnagIt — this
item downloads the optional SnagIt
Evaluation software for advanced screen capture capabilities (must be
connected to the Internet). Once you
have downloaded the install file, close all open programs, run the install file
and follow the on-screen instructions.
The program, sample data and support materials require approximately
40MB free disk space to install. The
evaluation program will expire in 30 days.
You must purchase and register to continue to use (recommended). See Instructor
CD description (below) for more information on fully licensed SnagIt system.
 2.
Additional Online Materials — Description of other materials available online.
2.
Additional Online Materials — Description of other materials available online.
Author’s Website at www.innovativegis.com/basis contains
links to a wide array of additional materials on grid-based map analysis and
modeling.
Online Books and Materials include—
Map
Analysis by Joseph K. Berry is a compilation of
Beyond Mapping columns appearing in GeoWorld magazine from 1996 to
present (some items translated en Español).
Map Analysis Workshop
Materials by Joseph K. Berry contain all of the materials (PowerPoint,
Software, Exercises) needed for a 4 hour (real-time demos) session or an 8 hour
(hands-on lab) session.
GIS Modeling Course by Joseph K. Berry
contains
all of the supporting materials (PowerPoint, Software, Exercises, Exams,
Projects) needed for a Junior/Senior/Grad college course.
Online Papers by Joseph K. Berry
contains links to numerous online articles and other major papers.
Example Applications is a set of annotated example
applications that illustrate map analysis capabilities and GIS modeling.
Hardcopy Books include—
Analyzing Geospatial Resource Data by J. K.
Berry (2005) is a workbook in spatial analysis and data mining as applied to natural resources management
containing companion software, databases and exercises (US$45).
Analyzing Geo-Business Data by J. K.
Berry (2003) is a workbook in spatial analysis and data mining as applied to real estate and retail applications
containing companion software, databases and exercises (US$45).
Analyzing Precision Ag Data by J. K.
Berry (2002) is a workbook in spatial analysis and data mining as applied to crop production containing
companion software, databases and exercises (US$45).
Spatial Reasoning by J. K. Berry (Wiley,
1995) is a compilation of Beyond Mapping columns appearing
in GeoWorld October 1993 to August 1996 exploring
the basic concepts of map analysis and emerging issues as
Beyond Mapping by J. K. Berry (Wiley,
1993) is a compilation of Beyond Mapping columns appearing
in GeoWorld march 1989 to September 1993 investigating the concepts, algorithms
and issues in
GeoPlace Website at www.geoplace.com contains <to be
completed>

3. Instructor CD — Description of the
optional instructor CD containing a comprehensive set of instructional
materials supporting a variety of workshops and courses including syllabus,
PowerPoint lectures, exercises, databases, and study/exam questions and
answers.
 General_ppt — this
item accesses several miscellaneous PowerPoint presentations on Map Analysis
and GIS Modeling for a variety of forums.
General_ppt — this
item accesses several miscellaneous PowerPoint presentations on Map Analysis
and GIS Modeling for a variety of forums.
GM_course — this item accesses Instructional materials
supporting an upper-division ten-week semester course in Map Analysis and GIS
Modeling including lecture PowerPoints, exams, readings, projects and exercises using MapCalc Learner and Surfer
Demo software.
GM_workshop — this item accesses instructional materials
supporting a one-day workshop in Map Analysis and GIS Modeling including
lecture PowerPoints, workbook material and optional hands-on exercises using
MapCalc Learner and Surfer Demo software.
MA_seminar — this item accesses instructional materials
for a two-hour seminar in Map Analysis including lecture PowerPoints, general
notes and real-time demos using MapCalc Learner software.
The
instructional materials reflect the circumstances of their original
presentations. You are encouraged to
reorganize, edit and integrate the materials with our own resources as
appropriate for your class offering.
Much of the material was developed and originally presented at the University
of Denver and the author greatly appreciates the opportunity to serve as the
Keck Scholar in Geosciences for the Department of Geography. Without this intellectually stimulating
atmosphere these materials would not have been compiled.
These
Educational Materials for Instructors include several sets of resources
developed by Joseph K. Berry (© Joseph K. Berry, 1990-2006). You are free to use the materials for
educational purposes. If you use copies
of the materials for professional presentations and papers, please reference as
“(After Berry)” within any graphics and cite in the references section as
“Berry, J. K., 2006. Educational Materials for Instructors, Instructor’s
CD with the book Map Analysis published by GeoTec Media.”
As
appropriate, cite the MapCalc software as “MapCalcTM Learner and
Academic software, www.farmgis.com, Fort Collins, Colorado, USA” and the Surfer
Tutorial software as “SurferTM Tutorial software,
www.goldensoftware.com, Golden, Colorado, USA.”
The
educational materials are constantly being revised and you are encouraged to
periodically visit www.innovativegis.com/basis
for more information and current status.
Questions and comments on contents concerning the educational materials
should be directed to jberry@innovativegis.com.
The
Instructor’s CD is available for US$45 plus shipping and handling charges. Contact the author at jberry@innovativegis.com to order.
The
MapCalc Learner, Surfer Demo and SnagIt Evaluation software are licensed for
single individual use and cannot be installed in a multi-seat computer lab
environment nor used for funded research or commercial use. The licensing terms and current 2006 pricing
for academic and professional versions of the software are identified in the
table below.
|
|
Individual |
Multi-seat Academic License |
Full License |
|
MapCalcTM BASIS |
MapCalc Learner software provided
with the Map Analysis book companion CD has a two-week evaluation period. A
release code for extended personal educational use is provided. The Learner version has full analytical
functionality but is constrained to 100x100 analysis grid and does not
contain projection or other spatial handling modules. Free Eval US$21.95 |
MapCalc Academic is intended for a
multi-seat lab use (up to 20 seats) and licensed for educational use only and
not for funded research or commercial use.
The analysis grid is not constrained and projection or other spatial
handling modules are included. The Instructor’s CD is bundled with the
academic version. US$495.00 |
MapCalc Professional is a single-seat
version licensed for funded research and commercial use. The analysis grid is not constrained and
projection or other spatial handling modules are included. US$695 Multi-seat pricing available |
|
SurferTM Golden Software |
Surfer Demo provided with the
Map Analysis book companion CD has an unlimited evaluation period. The Demo version has full analytical
functionality but limited output and file saving. Free Demo US$599.00 |
Multi-seat
licensing for educational institutions is available—contact Golden Software |
Fully
licensed single-seat version licensed for individual, funded research and
commercial use. US$599.00 Multi-seat pricing available |
|
SnagItTM TechSmith |
SnagIt
Evaluation download link provided with the Map Analysis book companion CD has
a 30-day evaluation period. The Eval
version has full functionality. Free Eval US$39.00 (academic) US$21.95
|
Multi-seat
licensing for educational institutions is available—contact TechSmith |
Fully
licensed single-seat version licensed for individual, funded research and
commercial use. US$39.00 Multi-seat pricing available |
___________________________
Index