|
Beyond
Mapping I Topic 4 – What
GIS Is and Isn’t — Spatial Data Mapping, Management, Modeling and More |
Beyond Mapping book |
Technobabble — discusses
the radical changes GIS technology and the digital map are bringing to
traditional mapping
What’s Needed to Go Beyond
Mapping — lists and
describes the analytical tools needed to go beyond mapping
Who Says You Can’t Teach an Old Dog New Tricks?
— describes the basic concepts and
approaches used in GIS modeling
Frankly My Dear, I Don’t Give a Damn — discusses
how GIS modeling and spatial reasoning are changing policy formation and
decision-making
<Click here> for a printer-friendly version of this topic
(.pdf).
(Back to the Table of Contents)
______________________________
Technobabble
(GIS World, February/January 1991)
…is
that seemingly endless drone masking what would otherwise be a clear
understanding of technology
If
you have been following the Beyond Mapping series some strange things have been
suggested‑‑ map‑ematics, effective
distance, map derivative, weighted windows, optimal path density, and net
weighted visual exposure density surface.
"You can't do that to a map; that's disgusting; are you sure it's
legal?", may have been but a few of your
comments. Technobabble. Just a bunch of technobabble.
Professor
Hough of San Francisco State University's Communication Arts Department sums it
up‑‑ "GIS is not just warm, woolen socks." He explains that it is a change in mapping
(and communications for that matter), like the cocoon to the caterpillar and
butterfly. Ugly, but
effective. To those on the
outside, the cocoon just sits there. To
those on the inside, there is total upheaval and complete restructuring. Such is the metamorphose
brought on by the digital map.
Well,
maybe, maybe not. Most of the practical
applications of GIS involve automating current manual procedures. Correct that‑‑ most involve investing
in a database which, hopefully, will eventually automate the current manual
procedures. A lot of
work, to do what we have been doing for years. The perceived benefit, once GIS is on‑line,
is that we can do it faster, more detailed and colorful. The butterfly is obviously superior to the
worm. But more importantly, it is
radically different. The understanding
of the differences and developing new procedures is The
“behind the scene” revolution of GIS in the 1990's. It's not business as usual.
Consider
the familiar map overlay operation.
Suppose you are interested in locating your company's forest management
parcels containing both Douglas fir trees and Cohasset soil. In the 1960's, your cartographic solution was
to overlay both maps on a light‑table and
sketch. The result was a single map
depicting the intersection. Good spatial
characterization. However, if acreage
estimates were required, hours of planimeter or dot grid work were
required.
Your
statistical procedure more likely involved searching a data base. Data such as acreage, timber and soil types
for each management parcel was written on a card. Holes were punched along the edges to
summarize the information. A geographic
search simply involved passing a long needle through the appropriate edge
position. When lifted, the parcels
meeting that condition fell out of the stack.
Repeat with the 'sieved' subset, and the cards containing both
conditions fell out‑‑ Douglas fir and
Cohasset soil. Add up the acreage. Good statistical characterization.
A
couple of problems persisted‑‑ the procedures were tedious and
disjoint. You could spend hours drafting
and calculating for even a simple query over a small area. So what, the procedures are as comfortable as
a pair of warm, woolen socks. Some folks
even argue that the time involved is peanuts in comparison to the hours of
creating, caressing and cursing an automated data base. Valid argument. Each of us knows our most efficient mode.
But
the problem of the two manual systems being disjoint is critical. It is not just a matter of time. It's the nature of the information derived‑‑
an answer to a specific question, a dead end.
It doesn't become part of the data base.
It cannot be easily shared with others and their subsequent analyzes
incorporated. Your drafting and
calculating, for all you know, may be repeated the following week by a
colleague down the hall.
In
large part, the capacity of the computer to store and share information is what
tipped the scales from index cards to data base management. At least in the beginning, it certainly
wasn't efficiency and ease of use. The
transition was (is?) painful for most of us.
Now the 'Information Age' is being heralded as the modern equivalent of
the Industrial Age. Not merely a
progression of technology, as much as a radical departure.
It's
like the automobile. At first, it was
just an engine affixed to a wagon.
Aspirations for the new fanged thing were to do the work of a team of
horses. Nothing more;
nothing less. But as the car
evolved, new demands for speed and capacity continuously redefined the
'automated wagon.' Entirely new
concepts, such as aerodynamics, four‑wheel drive and catalytic
converters, have become commonplace. Nostalgia
aside, isn't the car a vast improvement on the wagon? Although different, it's not that
complicated to learn to drive a car over a driving a team of horses. You get there a lot quicker. And can do more.
The
transition from the horse to horsepower, however, required both personal and
social investments. GIS is placing
similar demands. Your challenge is to
understand the differences between traditional map processing and apply these
new procedures in creative ways. But
that's not enough. It's like the 80 mph Bugatti. Awesome,
but it's useless unless there are 80 mph roads.
A washboard, wagon trail not only limits your potential, but is down‑right dangerous.
That's
where we are with GIS. The equivalent of
supersonic (or supernatural, your choice) procedures for map analysis are in
place. Most folks opt to keep things
down to earth and apply GIS in traditional ways. Those that choose the high road soon find that
the base data is as rocky as a wagon trail.
Our historical concepts of mapped data are rooted in the map as a
generalized image for human viewing. But
GIS considers maps as rather large sets of numbers poised for quantitative
analysis. Creation of an image is just
one of the things you can do.
Statistical and mathematical analytics comprise a multitude of other
things.
GIS,
from this perspective, is the blend of cartographic and numerical processing
that was missing in the 1960's. The
concept that it is a 'cash register' in which transactions on the landscape are recorded is one manifestation of the link. Tremendously useful, but challenges neither
the basic procedures nor the basic data form.
The ensuing articles in Beyond Mapping will do both. Even something as
intuitively obvious as overlaying a couple of maps will be contorted into
whether it is a 'point‑by‑point', 'region‑wide', or
'map‑wide' operation. Concern for both spatial and thematic 'error
propagation' is also a must. Technobabble. TECHNOBABBLE!
...but it's interesting. Sort of
like those electronic woolen socks with a nine volt battery you slip into your
ski boots.
What’s Needed to Go Beyond Mapping
(GIS World, April/March 1991)
... “to boldly go where no man
has gone before” (StarTrek), I had better pack a toothbrush
GIS
is a workhorse. It manages our spatial
data. It provides timely updates to our
data bases. Creates
colorful and valuable map products.
In short, it is rapidly becoming an integral part of our record keeping
and report generation... 'Useful.'
However, to some, it is an ill-tempered race horse, moving at breakneck
speed. Expensive and
cantankerous at best. The domain
of the overly-indulgent rich... 'Frivolous.'
To others, it is a Pegasus, whose wings soar us
to new heights. A
radical departure from traditional mapping. With entirely new
concepts... 'Dreams.'
In
reality, it is all three. The digital
nature of GIS maps provides the skeleton for each perspective. Once you have a computer-compatible map, only
your imagination limits its use. Well,
that and your software vendor. Like
horses, GIS software comes in a wide variety of sizes, shapes and colors. A Clydesdale just won't make it at a fox hunt
with the queen. Nor is a thoroughbred
suited for the plow. In
selecting your 'best-fitted beast', its functionality in large part that
determines its appropriate use.
The overlaying and geographic searches of the mapping and data
management functions of a GIS are relatively familiar to most current and
aspiring users. But what is needed for
GIS modeling (map analysis)? What takes
a GIS beyond mapping?
Below
is a checklist of the analytic capabilities that go beyond the basic GIS
procedures. It is designed to spur
discussion among users and vendors, as well as provide a structure for both
past and forthcoming Beyond Mapping articles.
'If
I wanted it all, I would want...'
MATHEMATICAL OPERATORS
-
Basic Math -- the most
frequently used buttons on your pocket calculator. Add, subtract, multiply, divide, average,
etc.
-
Advanced Math -- the rest of the
buttons. Such as the trigonometry
functions, powers, roots, etc.
-
'Macro' Command Language -- the ability to
branch, loop, and test within a sequence of map processing commands.
SPATIAL STATISTICS
-
Descriptive Statistics -- describe a single
map variable or set of map features. For
example, a standard normal variable (SNV) map identifies statistically
'unusual' areas and is computed by—
SNV= ((Xobs - Xmean)/Xstdev) * 100
where Xobs
is the observed value at a particular location; Xmean
is the map wide average of the variable; and Xstdev
is the standard deviation of the variable. Another example is the calculation
of the average for one mapped variable (e.g., slope) for a set of map features
(e.g., timber harvesting parcels). A
basic set of statistical procedures include the frequency counts, average,
standard deviation, coefficient of variation, minimum, maximum, mode, median,
diversity, deviation and proportion similar.
-
Comparative Statistics -- compare two or
more map variables or sets of map features.
For example, a simple t-test can be used to compare the similarity
(coincidence) between two maps. A basic
set of statistical procedures include simple and frequency weighted crosstabs,
Chi-squared, t, F, and Scheffe tests.
-
Predictive Statistics -- establish
relationships among map variables. For
example, a simple linear regression can be developed for predicting one map
variable from a set of other map variables.
A basic set of statistical operators include clustering and simple
linear, multiple, and curvilinear regressions.
DISTANCE MEASUREMENT
-
Simple Distance -- calculates the
shortest straight line between two points (Pythagorean Theorem).
-
Buffer
-- identifies all locations within a specified distance of a point, line or
areal feature, such as all locations within 100 feet of a stream.
-
Narrowness -- determines
'constrictions' as the shortest cord connecting opposing edges of an areal feature, such as a forest opening.
-
Simple Proximity -- identifies the
shortest, straight line distance from a point, line or areal feature to all
other locations in a mapped area.
Similar to a series of 'buffers' of equal steps emanating from a feature
like ripples in a pond.
-
Weighted Proximity (Movement) --
identifies the shortest, but not necessarily straight line distance from a
point, line or areal feature to all other locations in a mapped area. Distance is measured as a function of
absolute and relative barriers affecting movement (friction). Similar to a 'travel-time' map in network
analysis, yet movement is allowed over a continuous surface.
NEIGHBORHOOD
CHARACTERIZATION
-
Surface Configuration -- characterizes a
continuous surface's form. A basic set
includes slope, aspect and profile. An
advanced set includes an array of engineering techniques such as grade,
curvature and cut/fill.
-
Roving Window Summary -- summarizes values
within a specified vicinity around each location, such
as the total number of houses within an eighth of a mile creating a housing
density surface. A basic set of summary
operators include total, average, standard deviation, coefficient of variation,
maximum, minimum, mode, median, and diversity.
Statistics comparing the center of window to its neighbors includes
deviation and proportion similar.
-
Interpolation -- computes an
expected value for each map
location (continuous surface) based on a set of point
samples. A basic set includes weighted
nearest neighbor and Kriging techniques.
VISUAL EXPOSURE
-
Inter-visibility -- identifies if two
points are visually connected.
-
Viewshed Delineation -- identifies all
locations that are visually connected to a point, line or areal feature.
-
Exposure Density -- determines how
often each location is visually connected to a line or areal feature.
-
Weighted Exposure Density -- calculates a
weighted visual exposure value for each map location by considering the
relative 'visual importance' of each viewing point, line or areal feature. For example, an area visually connected to a
major highway will have a higher exposure value than another area connected the
same number of times to a lightly travelled road.
OPTIMAL PATHS
-
Simple Paths -- determines the
'best' route from one location to another along a set of lines (Network
Analysis) or over a continuous surface.
In the case of a terrain surface, it identifies water flow. In the case of a travel-time surface, it
identifies the quickest path.
-
Path Density -- counts the number
of paths passing though each element of a network or continuous surface that
optimally connects a set starting and finishing points. In the case of a terrain surface, it
identifies confluence (channeling) of water flows. In the case of a travel-time surface, it
identifies traffic confluence (heavily-used corridors), be it cars, hikers or
elk.
-
Weighted Path Density -- similar to normal
path density, except each path is weighted by the volume of flow along the
path.
SHAPE CHARACTERIZATION
-
Convexity Index -- a measure of the
boundary 'regularity' of an areal feature based on
the ratio of its perimeter to its area.
-
Fractal Geometry -- quantifies the
'complexity' of a feature's shape as an exponential relationship of its
perimeter, area and fractal dimension.
-
Spatial Integrity -- a measure of the
'intactness' of areal features relating holes and fragments of features forming
the map mosaic, such as clear cuts in a forested landscape.
-
Contiguity -- assesses the
'pattern' among groups of features, such as whether the clear cuts are clumped
together or evenly distributed in the landscape.
-
Inter-Feature Distance -- computes the
average distance within a set of map features, such as individual parcels of
endangered species habitat.
Whew! So that's all there is to it. At first glance, the advanced analysis
'grab-bag' may seem a bit overwhelming.
It appears less of a workhorse, than a whole pack team, all pulling in
different directions. But that's because
it’s unfamiliar; not that's it all that tough.
The majority of the concepts have been in your 'visceral' (if not your
conscious state) for a long time. Heaven
knows they have been in textbooks for years.
They're waiting for you to apply them in innovative ways that take you
beyond mapping. Just ask your software
vendor.
Who Says You Can’t Teach an Old Dog New Tricks?
(GIS World,
May 1991)
...but then again, it's about as tough to teach a new dog a new trick.
Now
that I am older with several years under (and over) my belt, I am enamored with
new tricks-- the GIS bag of tricks. I am
an old forester who has evolved from cyber-phobiac to
a cyber-philliac.
Nothing is more fun than wrestling with a new perspective on the old
venerable field of Forestry. I just
can't pass up the chance to comment on this issue's theme of 'GIS in Natural
Resources.' Before the word came down
from GIS World strategists, I had planned an article on some little-used
(esoteric?) analytical procedure like error propagation modeling or shape
characterization using fractal geometry and other assorted techy stuff.
All that is going to have to wait. Let's talk about the real world-- the deep
woods. The world of
dirt and slopes and trees and fish.
How about a new perspective on the old problem of timber harvesting and
fish romance? You know, create an map that says "if you run your skidder over here, it
will likely kill the spawning whoopee over there." (Note-- a skidder is a tractor-like thing
that drags trees around in the woods... for any utility company CIO reader
still around after last issue's theme).
Let's
consider this harvest-stopping loggerhead between the fish and the
forester. It's
simple-- leave a 100' buffer around class two streams. That ought to save the sexy salmon... or will
it? My bet is about the time you get
your harvest plan drafted and hung on the wall, the local angling association
will ask, "What would happen if, just to be on the safe side, you
considered a 200' buffer?" A valid question. A real concern.
Worse
yet, if you don't address it, chances are you will be asked the same question
by the judge at an injunction hearing.
But you already wore out a box of crayons (let alone your patience)
drafting the 100' buffer plan. You don't
have time to respond to every 'little' concern.
Like
those dark moments in an old western before the cavalry arrives, not all is
lost. GIS will save you. Just edit the 100 to 200 in your GIS model
and rerun it. It will take you moments,
and your silicon subordinate (computer) just minutes, to respond. Just as you thought, not much change in the
plan. Why wouldn't the fisherman and
judge believe you? You know these
things. You’re an old hand when it comes
to knowing what bears (and fish and owls) do in the woods. GIS is just another hoop they make you jump
through. A waste of
time. A waste
of money. But it does cover
your... ah, decisions.
You're
a crafty old fox who knows what GIS is, and isn't. Old woods wisdom put's this new fanged
technology in its place... a faster drafter.
It's not a new trick, just an accelerated old trick. The old dog is happy with that. But more importantly, are the fish
happy? Is your company's bottom line
happy? My guess is that your old
perspective on map analysis isn't helping either. I bet you're killing fish and loosing revenue
at the same time... with your concept of a GIS you're just doing it faster.
We're
not talking just trees and fish here, there is dirt in between. What you need is a realistic Sediment Loading
Potential (SLP) model as outlined in figure 1.
Let's apply some common sense.
The farther away from the stream you keep the skidder, the less the
sediment should cloud salmon romance.
That's why the fisherman wanted to increase the buffer. But are all buffer-feet the same? Not by a long shot. If there are steep slopes of sparsely covered
vegetation between your skidder and the fish, you had better be a lot farther
away than couple of hundred feet. But,
if gentle, vegetated terrain separates them, you could harvest well within a
hundred feet of the stream. Your old
trick, whether tediously or rapidly applied, killed the fish and robbed the
logger. It's just not that simple and
straight forward... 100 or 200 feet, your choice.
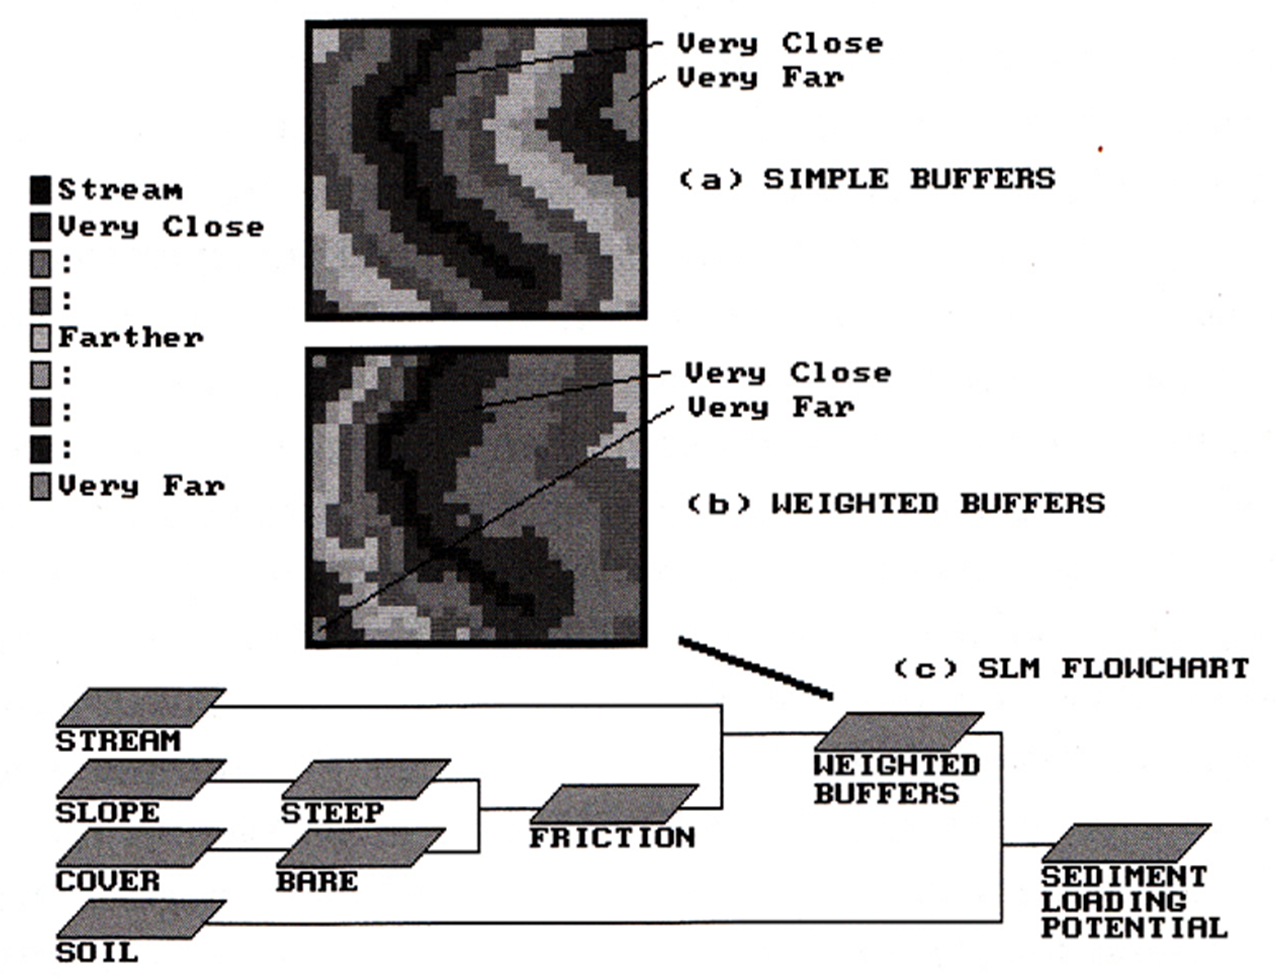
Figure
1. The top figure (a) shows a series of 100 foot
buffers around a stream. Figure (b)
shows a series of 'effective buffers' considering the slope and cover
conditions of intervening terrain. The
flowchart (c) depicts the Sediment Loading Model that identifies hazardous
areas.
You
need a new trick, like 'effective distance measurement.' This topic was driven into the ground several
issues ago, but it's definitely applicable here (GW Vol. 2-5 through Vol. 3-2,
Beyond Mapping column). We need a
'rubber ruler' that stretches in highly erodible places and shrinks in stable
ones. The accompanying figure shows this
effect. The map at the top calculates
sediment loading potential as simply the inverse of the distance squared. You can do this with a ruler. But you would be hard pressed to create the
more realistic map at the bottom which considers both intervening slope and
cover conditions in assessing effective sediment loading distance.
GIS
is more than just a faster mapper. It's more than a replacement for your old oak
file cabinets. It's a technology
providing new tools for resource management planning... spatial statistics,
effective distance, optimal paths, visual exposure, to name but a few. But as impressive this new toolbox is, it is
not the true revolution brought on by GIS.
The real impact of GIS is the way we do business. It provides the means for the US Forest
Service's "New Perspective" on forestry-- a capability for consensus
building and conflict resolution.
All
GIS models, whether simple or complex, have three characteristics. They are flexible, succinct,
and dynamic. Once a model has
been developed, it encourages the addition of new considerations and parameter
weights. It almost shouts, "You
want to try it a different way?"
When is the last time your draftsperson demonstrated such
flexibility? And in an
agreeable manner to boot.
Computers,
by nature, are stupid. They can do lot
of things, but they don't know what to do.
Each step has to be 'made perfectly clear.' This can be frustrating, but valuable in the
long run. The GIS model becomes a clear
statement of the analysis procedure. It
succinctly summarizes the voluminous appendices of most reports. Note the flowchart at the bottom of the
figure 1. It shows that the effective
distance from streams is a function of the intervening slope and cover
conditions. It takes sediment loading a
step further, by considering the soil conditions... SLP= fn(slope,
cover, soils). Or in other words, if you
run your skidder on unstable soils you are likely to disturb the dirt. If this disturbance is effectively close to
the stream, you got a problem. If it is
effectively far away (even though it may be 'ruler' close), the sediment
loading potential is low. This is common
sense-- expressed in five simple sentences to the computer. The model encapsulates and demonstrates your
rational thinking. Now the judge and
angler can 'see' what you’re talking about.
Finally,
GIS models are dynamic. They allow you
to try different scenarios-- different perspectives. Suppose your model for harvest planning
considers visual exposure, as well as slope and proximity to roads. The best parcels to log are those that are
gently sloped, with good access and minimal visual exposure. What if I suggest that visual exposure is ten
times more important than the engineering considerations? What parcels, if any, are no longer
appropriate for harvesting? In
philosophical space we might violently disagree. Every square foot appears to be contested. But do we disagree in geographic space? Where do we disagree? Which parcels are involved? Spatial answers, not ideological statements,
are needed. You run the model with your
perspective, and I will run it with mine.
Subtract the two 'solution' maps and we will see where and how we
disagree. That's information for
conflict resolution. That's dialogue for
consensus building. That's the GIS
revolution.
So
what's new in the natural resource management?. The seemingly un-natural technology of GIS--
that's what is new. To the old forester,
it at first appears to cramp his or her management style. Like the flower in the 'Little Shop of
Horrors' it just keeps growing as it shouts "Feed Me, Feed Me, FEED ME!"...
Digitize, Digitize, DIGITIZE! But
it's not just a new layer of record-keeping.
It's more than mapping and spatial data management. It's a new toolbox allowing you to plan in
more realistic manner. In fact, it's a
whole new perspective on the resource decision-making environment. I bet you can learn a new trick or two.
Frankly My
Dear, I Don’t Give a Damn (Rhett to Scarlet, in Gone with
the Wind)
(GIS World, June 1991)
The
last section introduced the idea that GIS is more than what 'meets the eye'
…more than a computer mapping system.
More than a spatial data base management system. Even more than an analytic toolbox. These capabilities are its parts‑‑
but the whole, in this case, is much more than the sum of its parts. GIS, in the final analysis, is a
communication device.
Like
Rhett, you may not give a damn. All this
new technology is more trouble than it is worth‑‑ just like
Scarlet. But there is still that spark
that attracts you. Maybe, just maybe,
there is something to all this GIS infatuation.
You have heard bits and pieces of its proclaimed capabilities. How it is going to change the way you do
things. But it certainly is a strange
beast, not unlike a Platypus. There are
bits and pieces of disciplines that are familiar, like computers and drafting
and statistics; but when assembled in its strange way, it is hard to understand
how it keeps afloat. That's GIS‑‑
a strange, but compelling beast.
As
a technology, I can take it or leave it.
It is interesting, but often seems academic, or even esoteric. It's just technology for technology sake,
isn't it? Or does it really improve
decision‑making? Or just improve
the vendor's bottom line? A real
question. A real concern... for 'real'
folks.
Consider
our current policy formation and decision‑making environments. Professor Vlachos, a natural resources
futurist at Colorado State University, identifies three inputs to this process‑‑
the Science, Social and Legal components of society (see figure 1). Loosely paraphrased, he states that a
delicate balance of all three is necessary to reach an effective decision. For example (my example, his are much better,
but his lively delivery is required), assume the populace of a developing country is suffering
from a dietary deficiency in animal protein.
Also, assume the country has vast areas of natural grasslands. Common sense (and voluminous tables of
research from the beef council) point to the easy technical solution of cattle
production.
That's
it‑‑ an
obvious, and technically supportable solution.
But wait a moment. There are
indigenous cultural and religious taboos against killing cows. And the legal concept of private property is
non‑existent.
Nor is there a precedent for land ownership and fencing. In short, the plan receives high technical marks
and appears acceptable from that single perspective. But, viewed differently, it fails the social
and legal tests. A
decision bust.
In
a less obvious fashion, the necessary balance among the three decision sectors
is what is upsetting our current decision‑ making. A technical solution often meets social
acceptance in a loggerhead. The result
is an injunction and the legal sector is called upon to make the management
decision. Black robes and a litany of
conflicting testimony replaces effective science and
social inputs.
Facing
the real prospect of litigation, we resort to a state of 'analysis
paralysis.' We constantly search for one
more decimal point accuracy to the technically 'perfect' solution. "If we could just get more data, the answer
would be obvious." Don't manage the
woods, inventory them. It's like placing
a sign at park headquarters‑‑ 'closed for inventory.'
But
maybe your data and analysis is good enough.
Not perfect, but good enough to make a decision. The problem could be the decision
environment. What is lacking,
is a capability to clearly communicate rational thinking and different
perspectives. The accompanying figure
summarizes these thoughts. An inability
to communicate causes the Social and Scientific inputs
to turn toward the Legal sector to solve their perceived differences‑‑
litigation. If I am not part of the
analysis process, chances are I don't fully understand, or trust it. Another hundred pages of appendices, or even
more colorful maps, won't help. See you
in court.
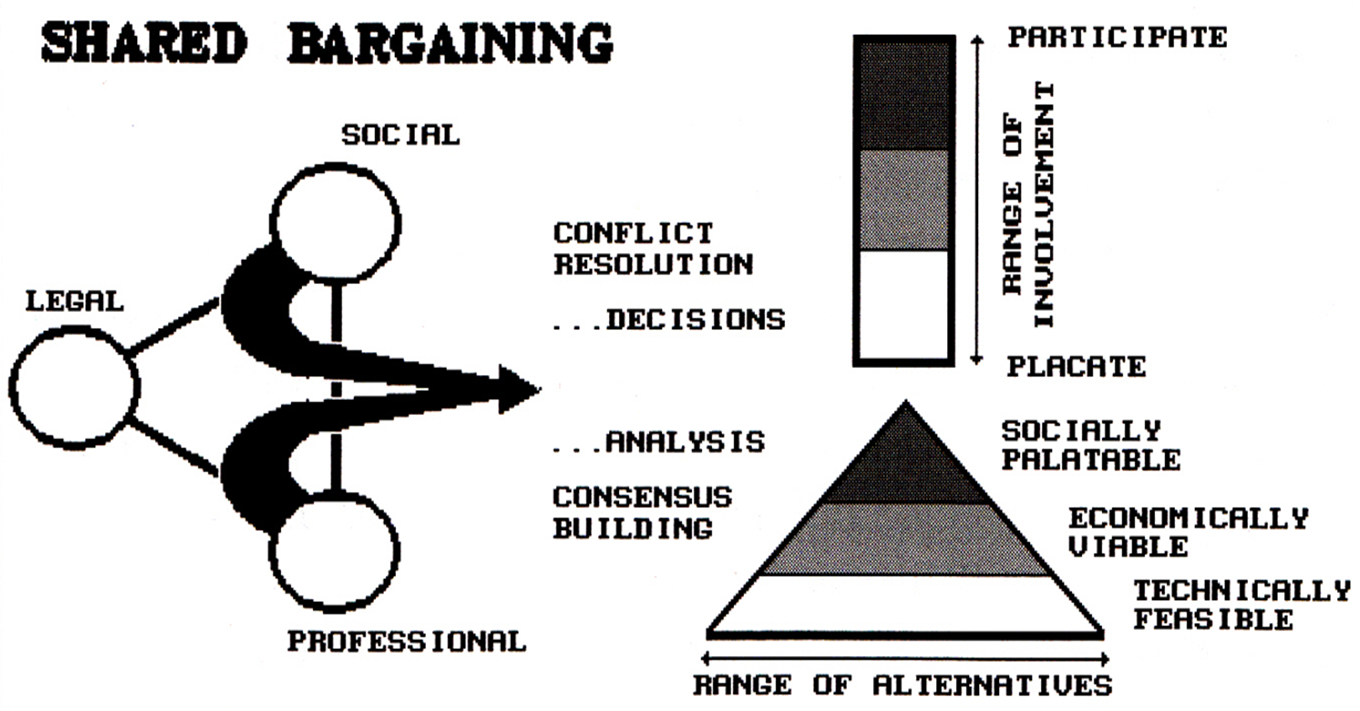
Figure 1. The considerations in effective decision-making require dialogue and participatory involvement, as well as technical and economic scrutiny.
However,
effective communication causes the inputs to turn away from the Legal sector in
search of an acceptable decision. The
right side of the figure addresses the working environment. Most geographic‑related decisions have
a relatively broad range of technically feasible options. As the pyramid depicts, there is a smaller
set of options that are economically viable.
We have developed elaborate procedures for assessing management options
that are both feasible and viable‑‑ the technical solution.
Yet,
in reality, there is an even smaller set of options are socially
acceptable. It is this final 'sieve' of
management alternatives that often confounds our decision‑making. It uses elusive measures such as human
values, attitudes, beliefs, judgement, trust and understanding. Not the usual quantitative stuff used in
computer algorithms and decision‑making models. So, what does all this have to do with
GIS? In a GIS, maps are numbers aren't
they? GIS is a technology, isn't
it? Well yes... and no.
The
step from feasible and viable options, to acceptable ones is not so much
science and economics, than it is communication. And effective communication implies
involvement. The range of involvement
(upper right portion of figure 1) extends from placation to actual
participation. Public hearings are often
more placation than participation. At an
initial hearing, concerned parties are asked for their input, but for practical
reasons, they are excluded from the analysis process. At a final hearing they are expected to
approve the results of analysis they do not understand. "Trust us. Everything is there. Just choose alternative A or B."
Participatory
decision‑making has two main thrusts‑‑ consensus building and
conflict resolution. Consensus building involves
technologically‑driven communication and occurs during the alternative
formation phase of the decision‑making process. It involves the GIS specialist's translation
of the various considerations raised by a decision team into a spatial
model. Once completed, the model is run
under a wide variety of conditions and the differences in outcome are
noted. From this perspective, any single
map solution isn't important. It is how
maps change as different scenarios are tried that becomes information to make a
decision. "What if avoidance of
visual exposure is more important than avoidance of steep slopes in siting the
new road? Where does the proposed route
change, if at all?" In nearly
twenty years of GIS consulting, I have consistently found that seemingly
divergent philosophical views most often result in only slightly different map
views. This realization often leads to
group consensus.
If
it doesn't, conflict resolution is
necessary. This socially driven
communication occurs during the decision formulation phase. It involves the creation of a 'conflicts map'
that compares the outcomes from two or more competing uses. Each management parcel (vector polygon or
raster cell) is assigned a code describing the conflict over the location. "This location is ideal for
preservation, recreation and development.
What should we do?" Make a
decision, that's what you need to do.
This process most often involves human rationalizing, or
'tradeoffs.' "Look here, I will let
you develop this parcel if you agree to assign that one to
preservation." The dialogue is far
from a mathematical optimization, but often closer to an effective decision. It uses the GIS to focus discussion away from
broad ideological positions, to the specific project area and its unique
distribution of possible uses.
GIS
is a mapping tool, a spatial data base management technology and a analytic
revolution. But what may be its most
important attribute is its ability to communicate. It isn't just a better technical answer, it
is a more comprehensible one. It fosters
discussion that often leads to understanding, and ultimately effective
decisions. Think of it. All Rhett and Scarlet needed was a bit more
constructive discussion, and they could have lived happily ever after in a
small duplex outside Atlanta.
_______________________________________

(Back to the Table of Contents)