|
Beyond
Mapping IV Topic 10
– Future Directions and Trends (Further Reading) |
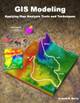
GIS Modeling book |
From
a Map Pancake to a Soufflé — continues the discussion of concepts
and configuration of a 3D GIS (December 2009)
<Click here> for a printer-friendly version of this topic (.pdf).
(Back
to the Table of Contents)
______________________________
From a Map Pancake to a Soufflé
(GeoWorld,
December 2009)
As the Time Traveller noted in H. G. Wells’ classic “The Time Machine,”
the real world has three geometric dimensions not simply the two we
commonly use in mapping. In fact, he
further suggested that “...any real body must have extension in four
directions: Length, Breadth, Thickness—and Duration (time)” …but that’s a whole
other story.
Recall from earlier discussion of 3D GIS that Geodetic Referencing
(geographic position) used in identifying an “areal extent” in two-dimensions
on the earth’s surface can be extended to a Database Referencing system
(matrix location) effectively defining a 3-dimensional “project block” (see the
left side of figure 1). The key is the
use of Geodetic Height above and below the earth’s ellipsoid as measured
along the perpendicular from the ellipsoid to provide the vertical (Z) axis for
any location in 3-dimensional space.
The result is a coordinate system of columns (X), rows (Y), and
verticals (Z) defining an imaginary matrix of grid elements, or “voxels,” that
are a direct conceptual extension of the “pixels” in a 2D raster image. For example, the top-right inset in figure 1
shows a 3D map of a cave system using ArcGIS 3D Analyst software. The X, Y and Z positioning forms a
3-dimensional display of the network of interconnecting subterranean
passages. The lower-right inset shows an
analogous network of blood vessels for the human body except at much different
scale. The important point is that both
renderings are 3D visualizations and not a 3D GIS as they are unable to
perform volumetric analyzes, such as directional flows along the passageways.
The distinction between 3D visualization and analytical systems arises
from differences in their data structures.
A 3D visualization system stores just three values—X and Y for “where”
and Z for “what (elevation).” A
3-dimensional mapping system stores at least four values—X, Y and Z for “where”
and an attribute value for “what” describing the characteristic/condition at
each location within a project block.
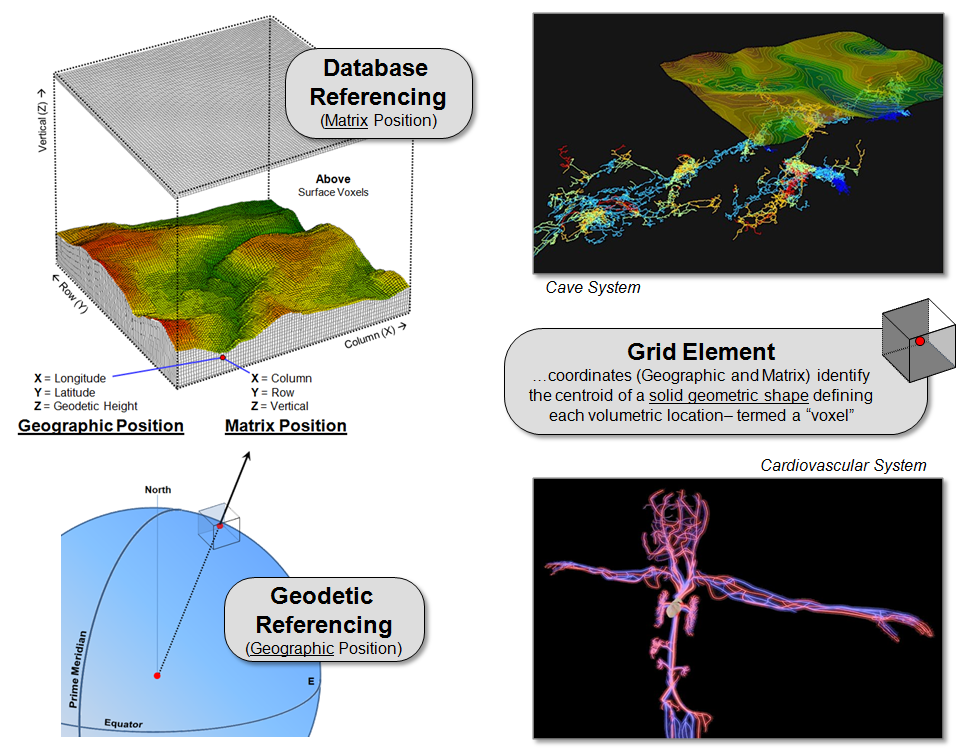
Figure 1. Storage of a vertical (Z) coordinate extends
traditional 2D mapping to 3D volumetric representation.
Figure 2 illustrates two ways of storing 3-dimensional grid data. A Flat File stores a single map value
for each grid element in a map block.
The individual records can explicitly identify each grid element (grayed
columns—“where”) along with the attribute (black column—“what”). Or, much more efficiently, the information
can be implicitly organized as a header line containing the grid block
configuration/size/referencing followed by a long string of numbers with each
value’s position in the string determining its location in the block through
standard nested programming loops. This
shortened format provides for advanced compression techniques similar to those
used in image files to greatly reduce file size.
An alternative strategy, termed an Interleaved File, stores a
series of map attributes as separate fields for each record that in turn
represents each grid element, either implicitly or explicitly organized into a
table. Note that in the interleaved file
in figure 2, the map values for Elevation, %Slope and Cover type identify
surface characteristics with a “null value (---)” assigned to grid elements
both above and below the surface. Soil
type, on the other hand, contains values for the grid elements on and
immediately below the surface with null values only assigned to locations above
ground. This format reduces the number
of files in a data set but complicates compression and has high table
maintenance overhead for adding and deleting maps.
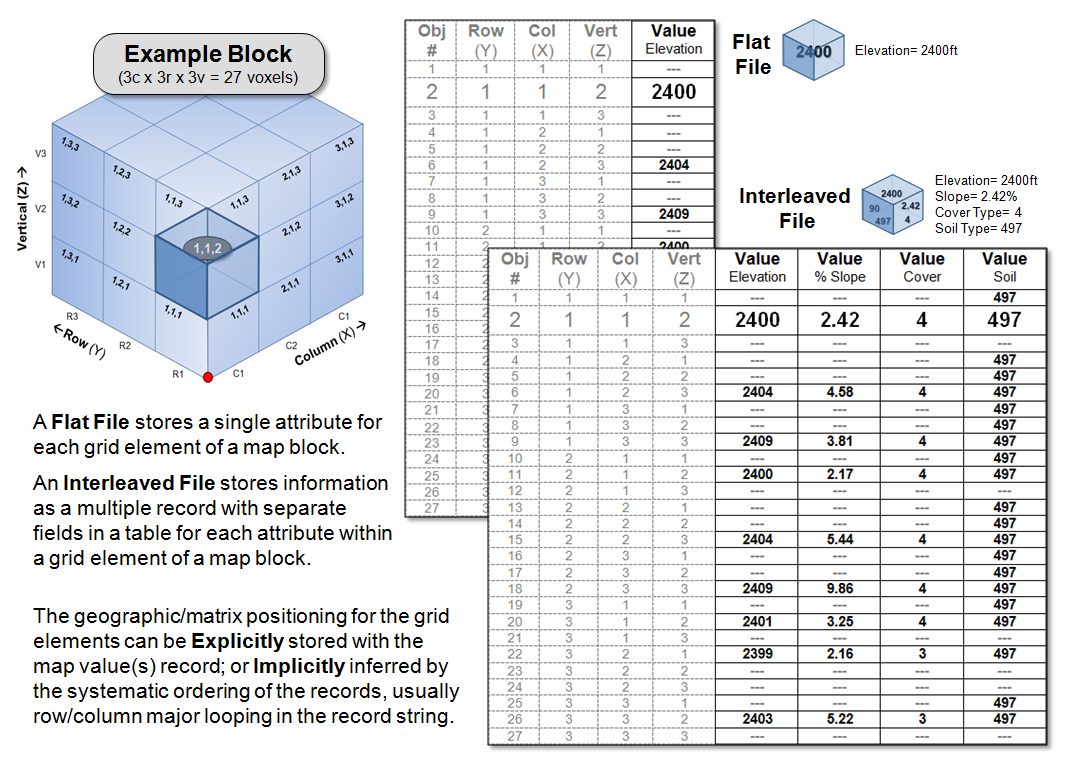
Figure 2. A 3-dimensional matrix structure can be used
to organize volumetric mapped data.
Figure 3 outlines some broader issues and future directions in 3D GIS
data storage and processing. The top
portion suggests that the inconsistent geometry of the traditional Cube
results in differing distances and facet adjacency relationship to the
surrounding twenty six neighbors, thereby making a cube a poor grid element for
3D data storage. A Dodecahedron,
on the other hand, aligns with a consistent set of 12 equidistant pentagonal
faces that “nest” without gaps ...an important condition in spatial analysis of
movements, flows and proximal conditions.
The lower portion of figure 3 illustrates the knurly reality of
geographic referencing in 3-dimensions—things change as distance from the
center of the earth or bounding ellipsoid changes. Nicely nesting grid elements of a fixed size
separate as distance increases (diverge); overlap as distance decreases
(converge). To maintain a
“close-packing” arrangement either the size of the grid element needs to adjust
or the progressive errors of fixed size zones are tolerated.
Similar historical changes in mapping paradigms and procedures occurred
when we moved from a flat earth perspective to a round earth one that generated
a lot of room for rethinking. There are
likely some soon-to-be-famous mathematicians and geographers who will match the
likes of Claudius Ptolemy (90-170), Gerardus Mercator (1512-1594) and Rene
Descartes (1596-1650)— I wonder who among us
will take us beyond mapping as we know it?
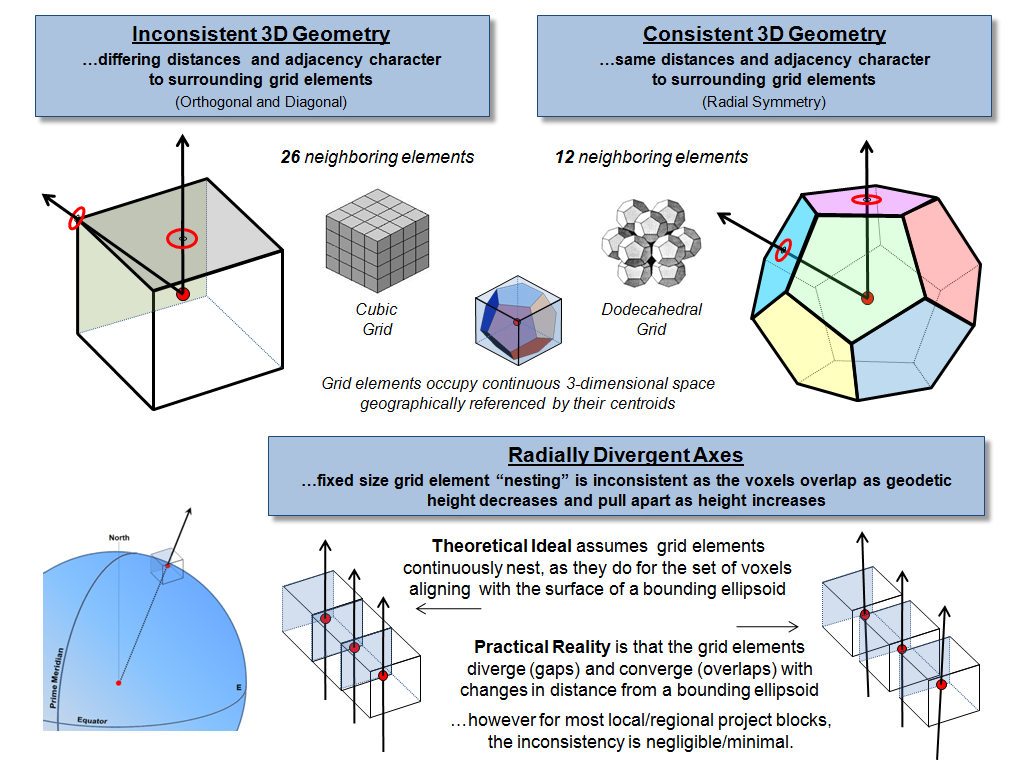
Figure 3. Alternative grid element shapes and new
procedures for dealing with radial divergence form the basis for continued 3D
GIS research and development.
_____________________________
Author’s
Notes: A good discussion of
polyhedral and other 3-dimensional coordinate systems is in Topic 12, “Modeling
locational uncertainty via hierarchical tessellation,” by Geoffrey Dutton in Accuracy
of Spatial Databases edited by Goodchild and Gopal. In his discussion he notes that “One common
objection to polyhedral data models for GIS is that computations on the sphere
are quite cumbersome … and for many applications the spherical/geographical
coordinates … must be converted to and from Cartesian coordinates for input and
output.”
(Back to the Table of Contents)